Process Capability
Excel and Google Sheets Template
What's Inside the Process Capability Template?
Details | 2 Sheets
Supported Versions | Excel 2010, 2013, 2016, 2019, Office 365 (Mac), Google Sheets
Category | Supply Chain & Operations, Data Analysis
Tags | Histogram, Six Sigma, Basic Tools of Quality, Index, Ratio
Why Professionals Choose Simple Sheets
It's simple. Access to the largest library of premium Excel Templates, plus world-class training.

100+ Professional Excel Templates
Optimized for use with Excel. Solve Excel problems in minutes, not hours.

World-Class Excel University
With our university, you'll learn how we make templates & how to make your own.

How-To Videos
Each template comes with a guide to use it along with how-to videos that show how it works.
Inside Our Process Capability
Excel and Google Sheets Template

In one of the funnier episodes of Seinfeld, Jerry recognizes a remarkable pattern of what Kramer refers to as him being ‘Even Steven.’. As quickly as he loses a job or misses the bus, he gets offered another one for the same amount of money and hops on the train. On the flip side, Jerry is surrounded by Elaine and George who are much more volatile, experiencing wins and losses that feel much more impactful on their emotional state.
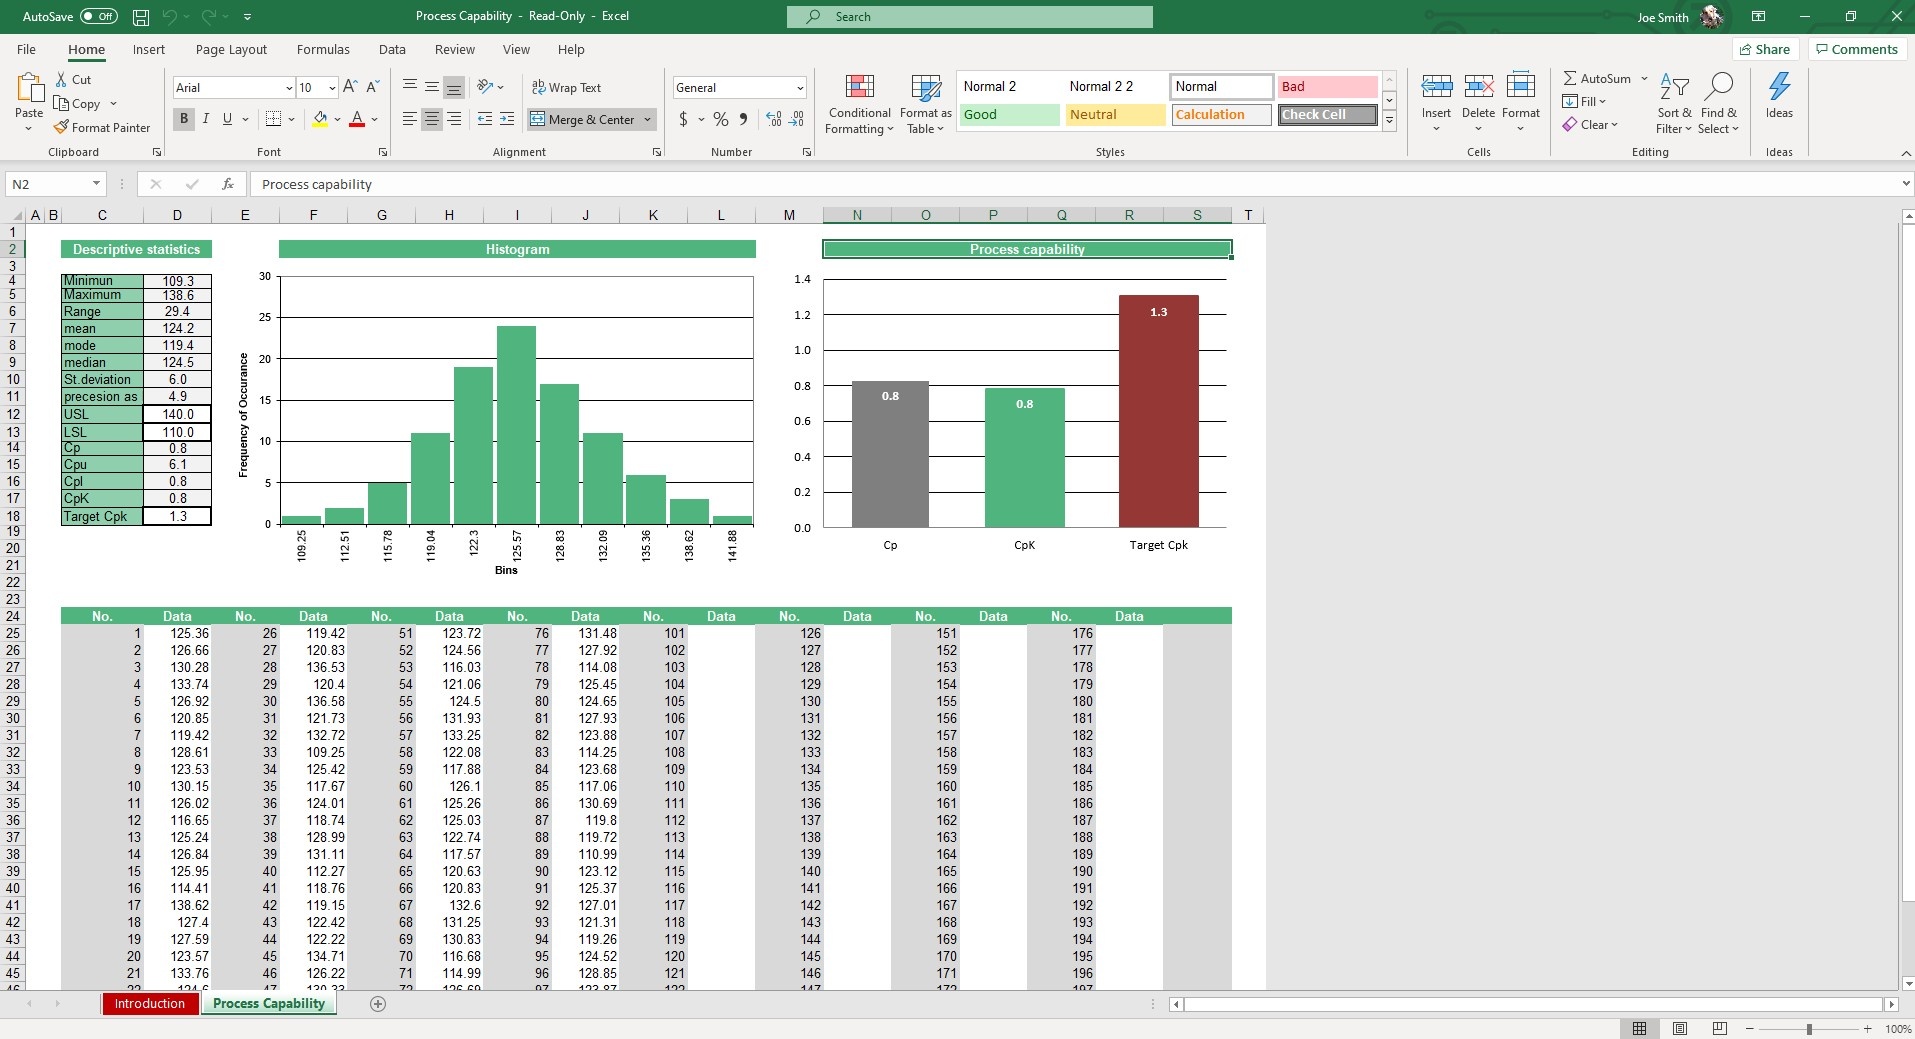
While we prefer our processes to operate with the stability of Jerry, they are often more like Elaine and George. There are always issues as it relates to productivity and it is often reasons we don’t see coming. Our Process Capability Excel Template is built to measure the variance of processes and display them among a bar chart and a histogram for easy analysis.
If you find this template useful, you’ll also want to check out our tools designed to improve the efficiency of your manufacturing processes such as Capacity Planning Analysis, Product Quality Control and Idle Time Analysis templates.
Let’s dive into how to use this spreadsheet.
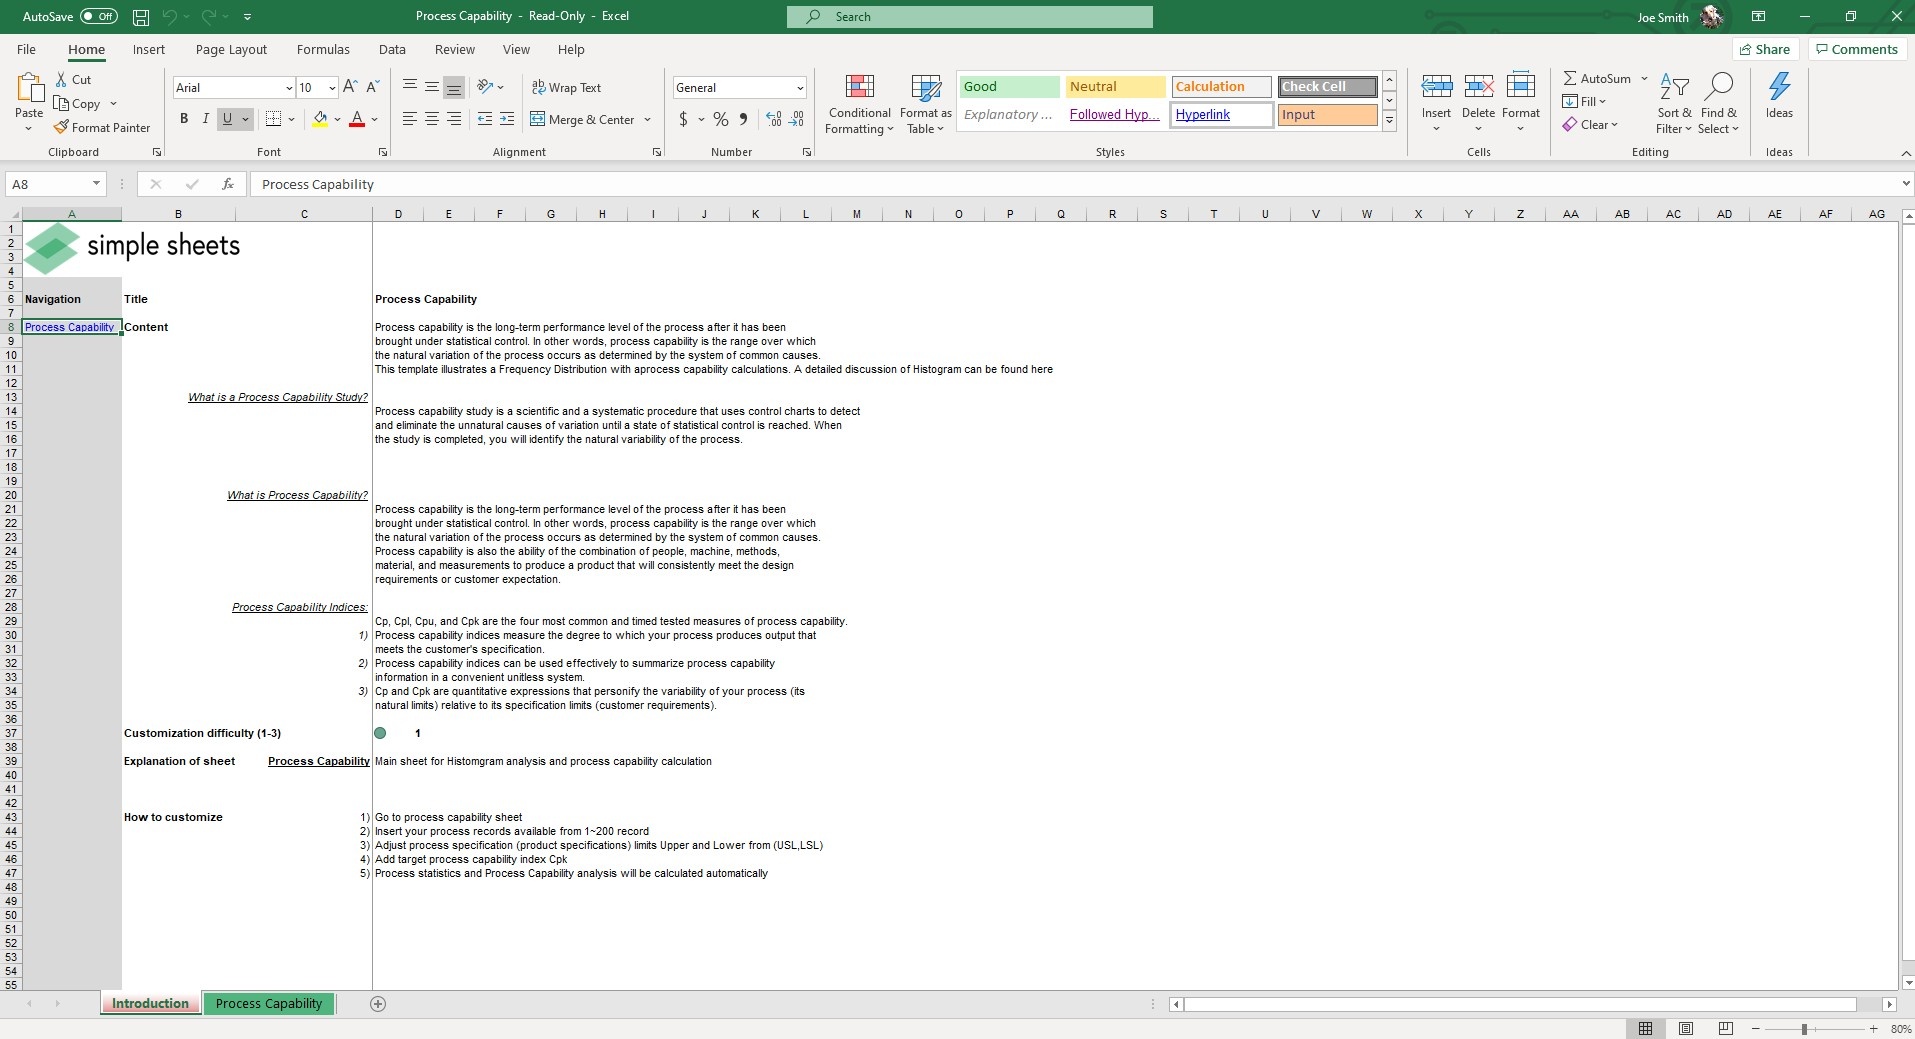
In the Process Capability sheet (the only usable one in this template) enter up to 200 process records.
While most of the numbers in the Descriptive Statistics header will calculate automatically based on your inputs, you do want to enter your USL (Upper Specific Limit), LSL (Lower Specific Limit), and Target Cpk (Process Capability Index).
Once your inputs are entered, the rest of the Descriptive Statistics (Minimum, Maximum, Range, Mean, Mode, Median, Standard Deviation, Precision as RSD, Cp, Cpu), your Histogram and Process Capability chart will display.

The Cpk value should be between 1 and 3. If it’s below 1, that’s a good sign that there is room for improvement.
From these calculations, you should have a much better way to identify the variability of your process and can start exploring the causes.
If that wasn't enough reason to get this template, did you know this template is compatible with Google Sheets? Collaborate with your co-workers in real time and enjoy the cloud auto-save feature of Sheets when you use this template!


