
Balance Sheet Template for Excel & Google Sheets
🎯 Best Value: This template + 30 more
Get this plus 30+ Accounting & Finance templates for just $79.
Get the Accounting & Finance Bundle — $79— OR continue with just this template below —
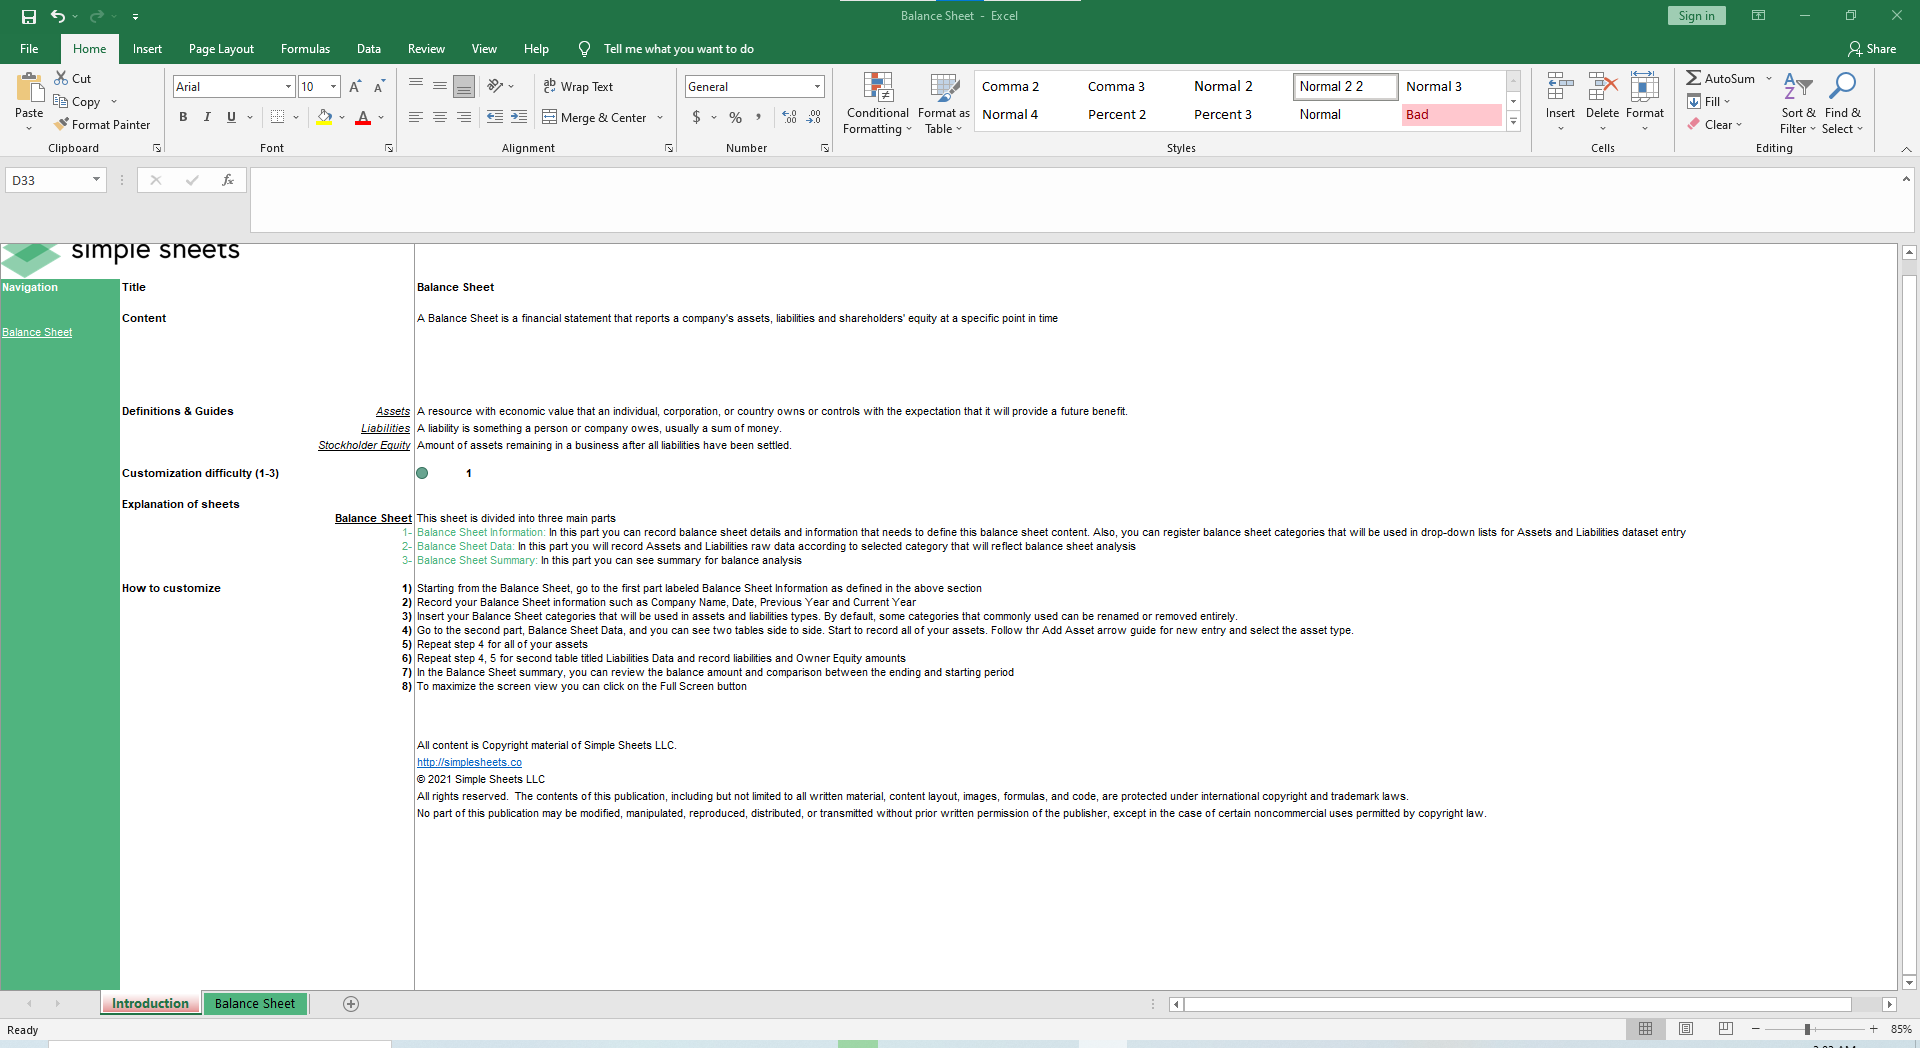
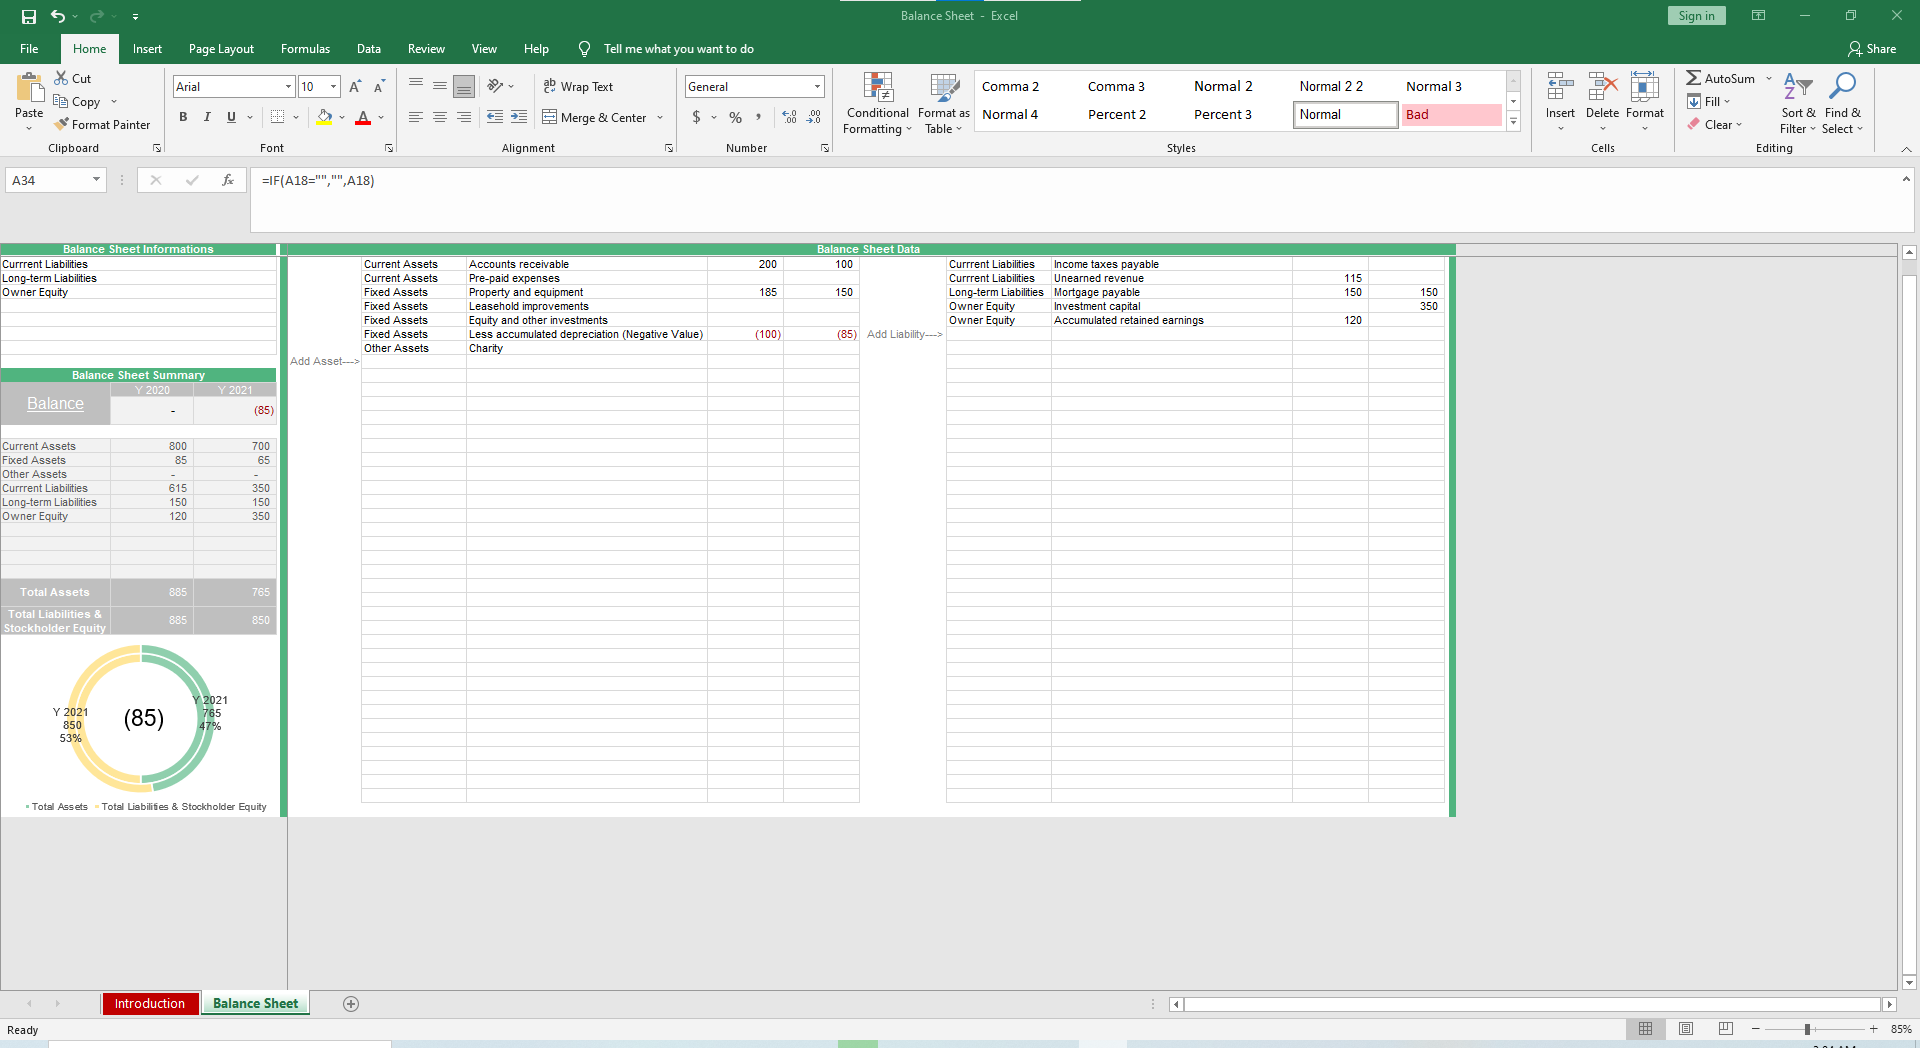
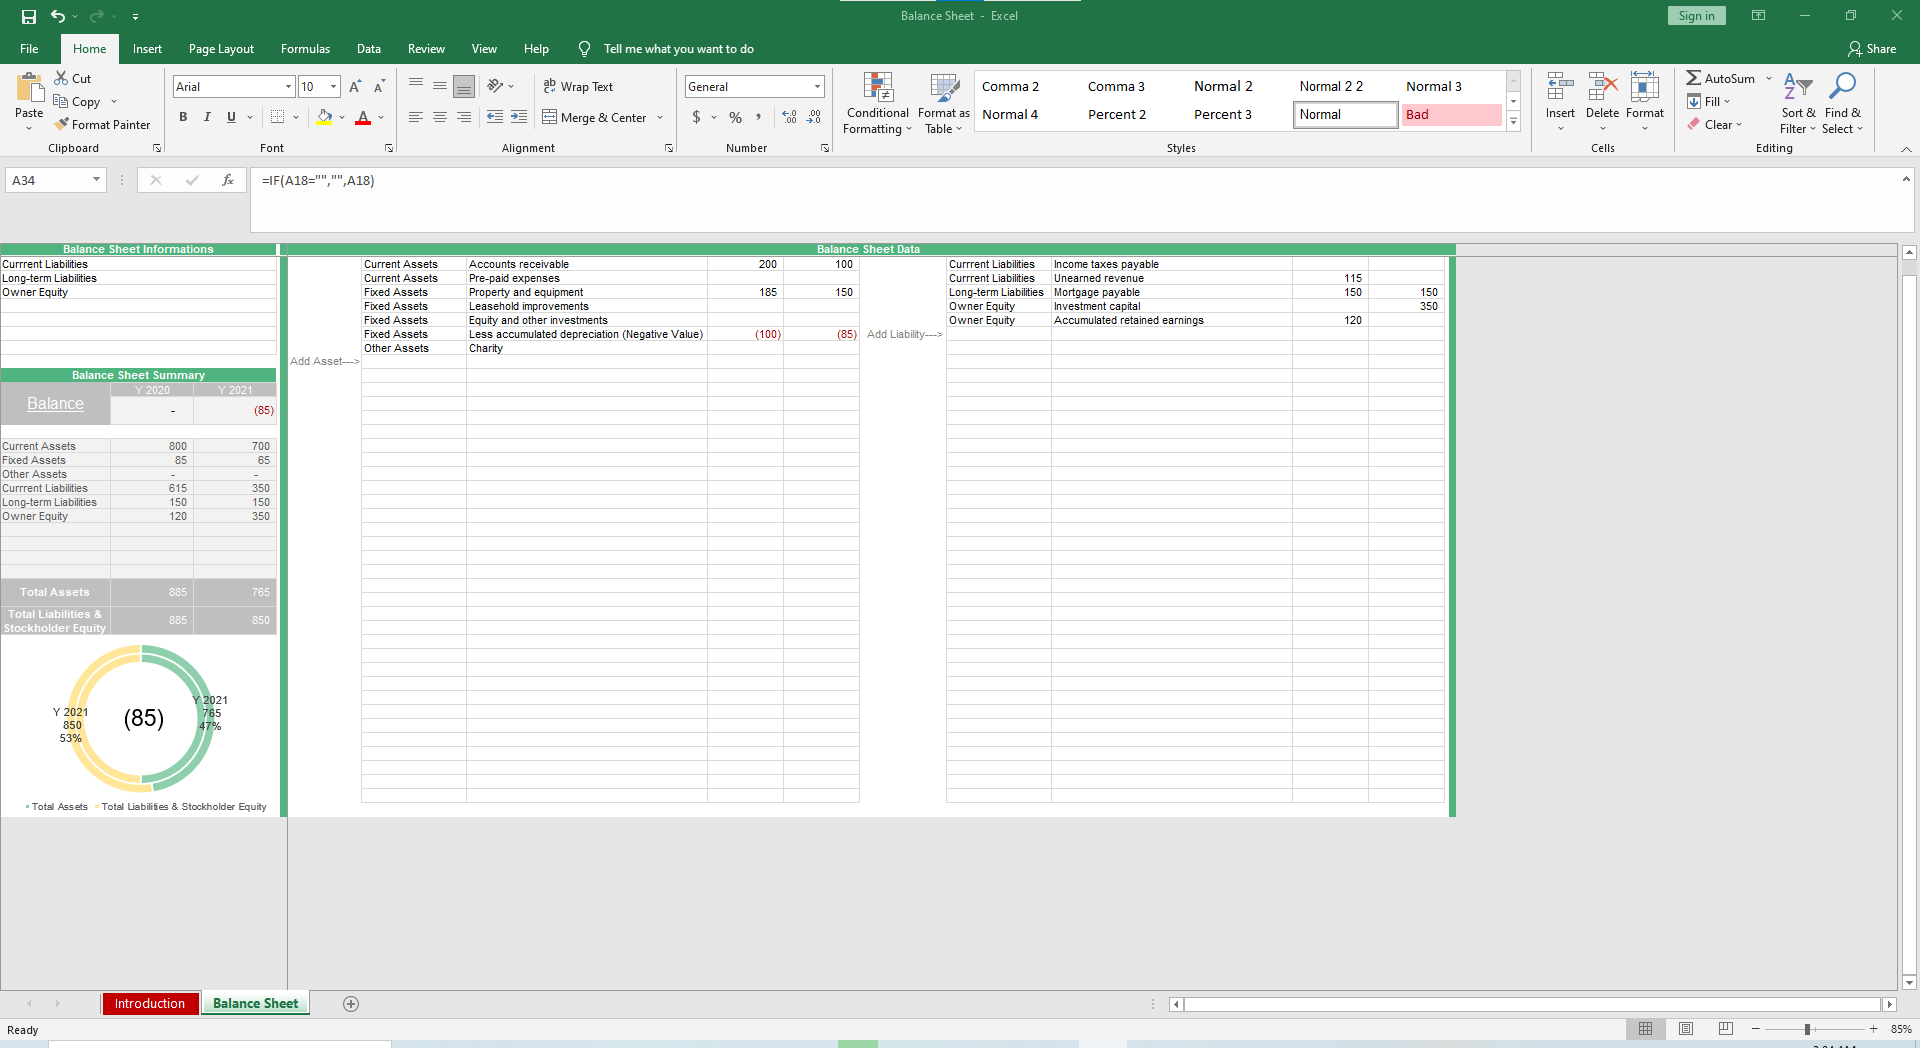
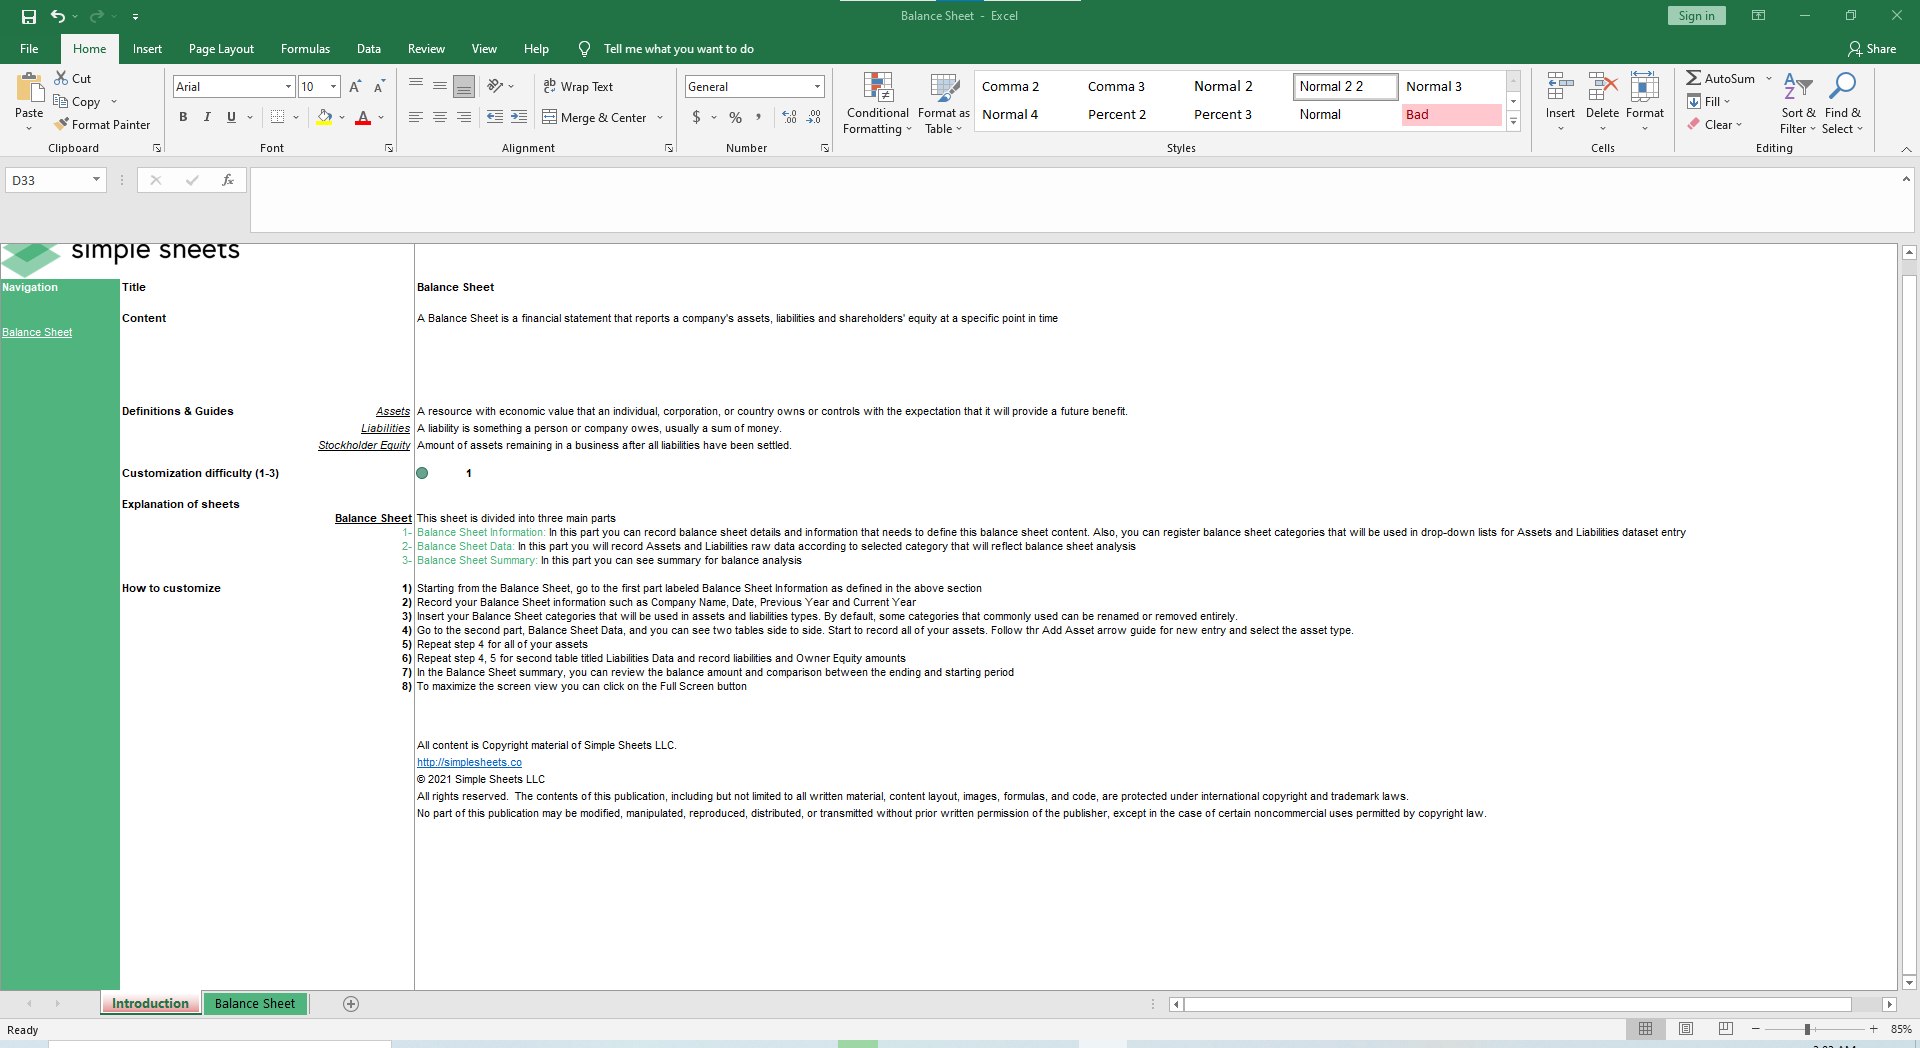
What's Inside the Balance Sheet Template?
Details | 2 Sheets
Supported Versions (All Features) | Excel 2016, 2019, Office 365 (Mac), Google Sheets
Supported Versions (Significant Features) | Excel 2010, 2013, 2016, 2019, Office 365 (Mac), Google Sheets
Category | Finance
Tags | Reporting, Profitability, Expenses, Income, Taxes
Why Professionals Choose Simple Sheets
It's simple. Access to the largest library of premium Excel Templates, plus world-class training.

100+ Professional Excel Templates
Optimized for use with Excel. Solve Excel problems in minutes, not hours.

World-Class Excel University
With our university, you'll learn how we make templates & how to make your own.

How-To Videos
Each template comes with a guide to use it along with how-to videos that show how it works.
Inside Our Balance Sheet for Excel and Google Sheets
Financial performance is the lifeblood of any business. You take out your expenses and taxes from your revenue to get your net income. It is a simple concept, but it greatly affects the nature of a business because for most managers, budgets play a pivotal role in creating business policies and strategies.
Making use of our Profit and Loss Statement Excel Template, empowers you to organize and track your income, expenditures, and taxes to be able to see the trends in order to know the profitability of your business to plan for both the short and long term. If you find this template useful, you’ll also want to check out our other financial templates like Balance Sheet, Cash Flow and Break Even Analysis.
Let’s dive into how you can customize this spreadsheet for your business. You can begin by inputting your company name and the period year. Then you can start populating the Income Details, Expenses, and Tax Details by replacing the existing placeholder entries for the categories on the leftmost column and filling up the corresponding rows for the appropriate month.
Note that the Gross Profit and Total Non-Operating Income rows are grayed out and centered, indicating that they contain formulas. Other rows which contain formulas are the total rows on the bottom of every table as well as the total column on the rightmost column.
After inputting all your financial data in the appropriate cells, the formulas will automatically calculate the sums of your revenue, expenses, and taxes, giving you your net income.
The sheet also comes with a simple yet powerful dashboard at the top, giving you a visual representation of your business’ financial performance over the year. The Month Over Month Gross chart should update automatically, and you can hit the refresh button on the bottom left of the dashboard to update the Expenses Analysis chart. The Expenses Analysis Chart also has slicers which you can use to quickly view the total expenses for a specific month, or a specific group of months, which allows you to make a quick cost-driver analysis.
It is always important to look at the past performance in order to formulate effective business strategies for the future. Organizing your financial performance data using a Profit and Loss Statement allows you to create relevant and achievable goals which would improve your business.
If that wasn't enough reason to get this template, did you know this template is compatible with Google Sheets? Collaborate with your co-workers in real time and enjoy the cloud auto-save feature of Sheets when you use this template!
Frequently Asked Questions
What's included in this balance sheet template?
Current assets (cash, receivables, inventory), fixed assets (equipment, property), current liabilities (payables, short-term debt), long-term liabilities, and owner's equity. Plus auto-calculating totals and a balance-check formula that verifies Assets = Liabilities + Equity.
Does it calculate financial ratios?
Yes. The template auto-calculates current ratio, debt-to-equity, and working capital — three standard balance sheet ratios. Updated as you enter new period data.
Can I use this for personal finances?
Yes. Simplify the business categories — use cash + investments + property as assets, mortgages + loans as liabilities — to get a personal net worth statement. Or use our personal balance sheet variant in the template.
How often should I update the balance sheet?
Most businesses update monthly or quarterly. The template lets you save multiple period snapshots (Jan, Feb, Mar...) so you can compare over time and watch trends like growing receivables or shrinking cash.
Does this template work with QuickBooks/Xero data?
You'll manually pull values from your accounting software into the template categories. There's no automated sync, but the structure matches standard GAAP balance sheet categories, so the import is straightforward.
Pair with: expense report template — feed real expenses into your monthly financial position.
What Is a Balance Sheet?
If you are wondering what is a balance sheet, it is one of the three core financial statements used to evaluate a business's financial health. Unlike other reports that track performance over a month or a year, a balance sheet provides a rigid snapshot of what your company owns and owes at a specific, exact moment in time—usually the last day of the month, quarter, or fiscal year.
Every reliable balance sheet template is built upon the fundamental accounting equation, which must always remain in perfect balance. The equation is straightforward: Assets = Liabilities + Shareholders' Equity.
To understand how this works, you have to break down the three primary components that make up the statement:
- Assets: These are the resources your company owns that hold measurable financial value. Assets can be liquid cash in the bank, the inventory sitting in your warehouse, or the heavy machinery used on your production line.
- Liabilities: These represent your company's financial obligations or debts owed to outside parties. This includes everything from the monthly rent and supplier invoices (accounts payable) to long-term bank loans and mortgages.
- Equity: Also known as owner's equity or net worth, this is the remaining value that belongs to the business owners after all liabilities have been subtracted from the assets. It includes the initial money invested to start the business plus any accumulated profits.
To see the accounting equation in action, consider a straightforward example. Imagine your business has $100,000 in assets (cash, equipment, and unsold goods). You also have a $40,000 small business loan and $10,000 in unpaid vendor invoices, bringing your total liabilities to $50,000. Because your assets must equal your liabilities plus equity ($100,000 = $50,000 + Equity), your total equity is exactly $50,000.
For most small business owners, manually calculating and balancing these categories can be tedious and prone to mathematical errors. Using a structured balance sheet template excel or Google Sheets file automates this entire process. By simply plugging your current account balances into the pre-formatted rows, the formulas instantly calculate your totals and verify that your assets perfectly match your liabilities and equity. Knowing exactly how to make a balance sheet empowers you to secure business loans, attract potential investors, and confidently make data-driven expansion decisions.
Balance Sheet vs Income Statement vs Cash Flow
To get a complete, 360-degree view of your company’s financial health, accountants rely on three interconnected reports. A common source of confusion for new business owners is the income statement vs balance sheet comparison, as well as where the cash flow statement fits in. Each document serves a distinctly different purpose and covers a different timeframe.
Here is a breakdown of how the big three financial statements work together:
- The Balance Sheet: As mentioned, this is a snapshot in time. If you generate a balance sheet on December 31st, it only shows your exact financial standing on that specific day. It tells you what you own (assets) and what you owe (liabilities) right now.
- The Income Statement: Often referred to as a Profit and Loss (P&L) statement, this report shows your business's performance over a specific period—like a month, quarter, or year. It tracks your total revenue and subtracts all operating expenses, taxes, and costs of goods sold to reveal your net income (profit or loss). If you need to log daily expenses, integrating an expense report process helps feed accurate data into this statement.
- The Cash Flow Statement: While the income statement tracks theoretical profit, the cash flow statement tracks the actual physical movement of cash in and out of your bank accounts over a period. It highlights operational cash, investing cash, and financing cash.
To make this comparison easy to digest, reference the table below:
| Financial Statement | Primary Purpose | Timeframe |
|---|---|---|
| Balance Sheet | Shows financial position (Assets, Liabilities, Equity) | A specific point in time (Snapshot) |
| Income Statement | Shows profitability (Revenue minus Expenses) | Over a period of time (e.g., Q1, Fiscal Year) |
| Cash Flow Statement | Shows actual cash movement and liquidity | Over a period of time (e.g., Q1, Fiscal Year) |
Ultimately, a robust business balance sheet template is just one piece of the puzzle. When you combine a financial statement template suite that includes all three documents, you gain total visibility over your profitability, your net worth, and your everyday liquidity.
How to Read a Balance Sheet (3 Key Ratios)
Filling out a basic balance sheet is only the first step; the real value comes from interpreting the numbers. Lenders, investors, and savvy business owners analyze balance sheet ratios to gauge operational efficiency and long-term financial stability. Once you have populated your spreadsheet, you can use your totals to calculate these three essential health metrics.
1. Working Capital
Working capital is a simple calculation that measures your company's short-term liquidity. You find it by subtracting your Current Liabilities from your Current Assets. If the resulting number is positive, your business has enough liquid assets to cover its immediate short-term debts. If the number is negative, you may struggle to pay your upcoming supplier invoices or make payroll without securing external financing.
2. The Current Ratio
The current ratio takes your working capital and turns it into a comparative metric. To calculate it, divide your Current Assets by your Current Liabilities. A healthy current ratio typically falls between 1.5 and 2.0. This means for every dollar of short-term debt you owe, you have $1.50 to $2.00 in liquid assets to cover it. A ratio below 1.0 is a red flag for lenders, while a ratio above 3.0 might indicate that you are hoarding cash instead of aggressively reinvesting in growth.
3. Debt-to-Equity Ratio
This ratio shows how much your business relies on borrowing to finance its operations. It is calculated by dividing Total Liabilities by Total Shareholders' Equity. A high debt-to-equity ratio means your company is highly leveraged and carrying a lot of risk, which can make securing additional bank loans very difficult. A lower ratio indicates a stable business funded primarily by owner investment and retained profits.
When you generate a new sample balance sheet at the end of each quarter, take five minutes to calculate these three numbers. Over time, you will spot trends in your liquidity and leverage, allowing you to course-correct before minor cash flow hiccups turn into major financial crises.
More Finance Templates For You


