Easiest Guide: How To Make A Scatter Plot In Excel
Mar 20, 2023
Do you need help learning how to make a scatter plot in Excel?
Worry no more because we've got you covered. In this article, we share simple steps in creating scatter plots for your data for easier visualization and analysis of two variables.
Read on as we cover the following:
-
What Is a Scatter Plot in Excel
-
Steps on How to Make a Scatter Plot in Excel
-
Final Thoughts on How to Make A Scatter Plot in Excel
-
Frequently Asked Questions on How to Make A Scatter Plot in Excel
Read Also: Convert Excel to Google Sheets: Step-by-Step Guide
What Is a Scatter Plot in Excel?
A Scatter Plot can also be known as a scatter diagram or an XY graph. A Scatter plot is a 2d graph presenting the relationship between two variables, represented by the X and Y axes.
The X-axis or the horizontal axis is the side-to-side line on a graph. Meanwhile, the Y-axis or the vertical axis is a graph up and down the line. It shows how changes in one variable can affect another variable.
Read Also: Excel IF Between Two Numbers Function: What is it?
Steps on How to Make a Scatter Plot in Excel.
-
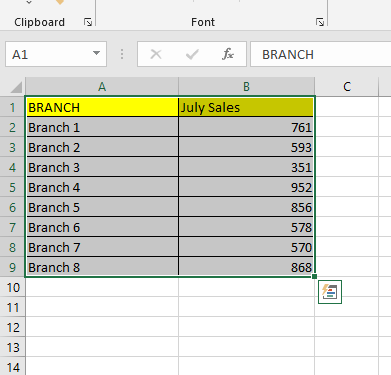
Prepare and Select your data.
-
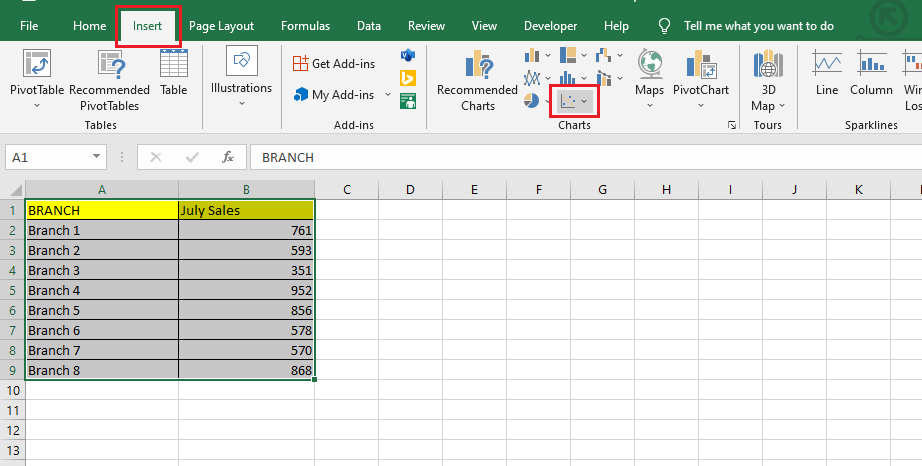
Go to the Insert tab and find the Insert Scatter (X, Y) or Bubble Chart option in the Charts Group.
-
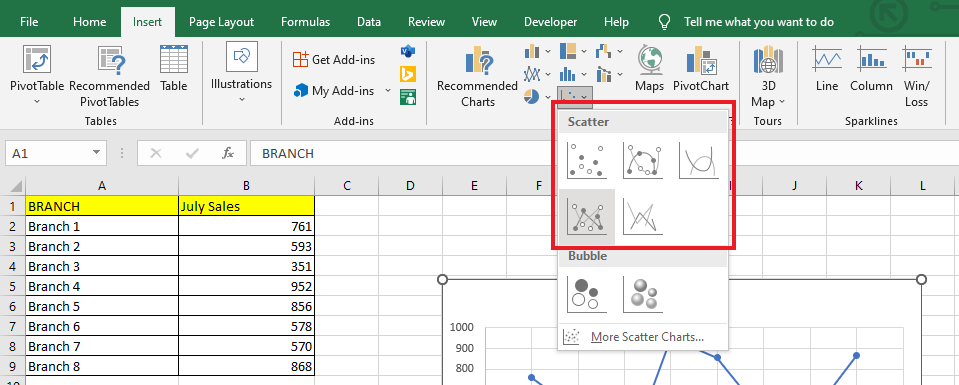
In the Insert Scatter (X, Y) or Bubble Chart option, you can choose five scatter chart types:
-
Scatter Chart.
-
Scatter Chart with Smooth Lines and Markers.
-
Scatter with Smooth Lines.
-
Scatter Chart with Straight Lines and Markers.
-
Scatter Chart with Straight Lines.
Note: Scatter Charts are the best option When dealing with more than two data points.
-
-
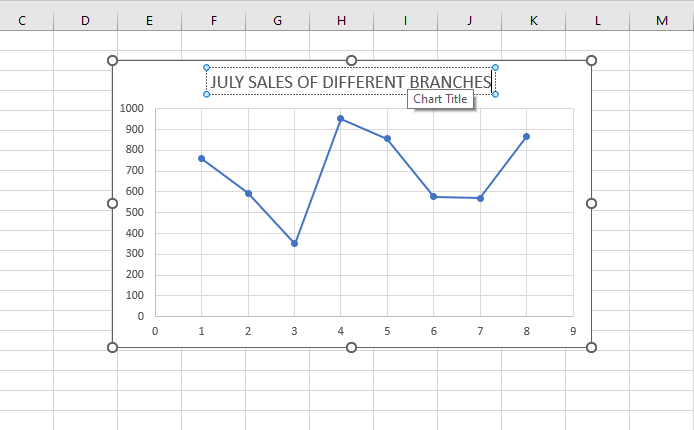
After you've chosen a scatter plot chart type for your data, change the Chart Title of your scatter graph.
-
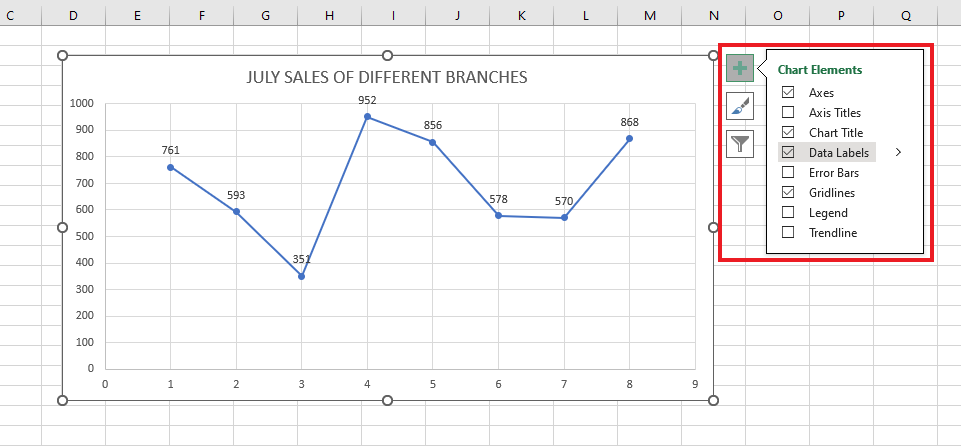
To format the data labels, go to the Chart Elements option and click "Data labels." Each data point will have numeric values.
-
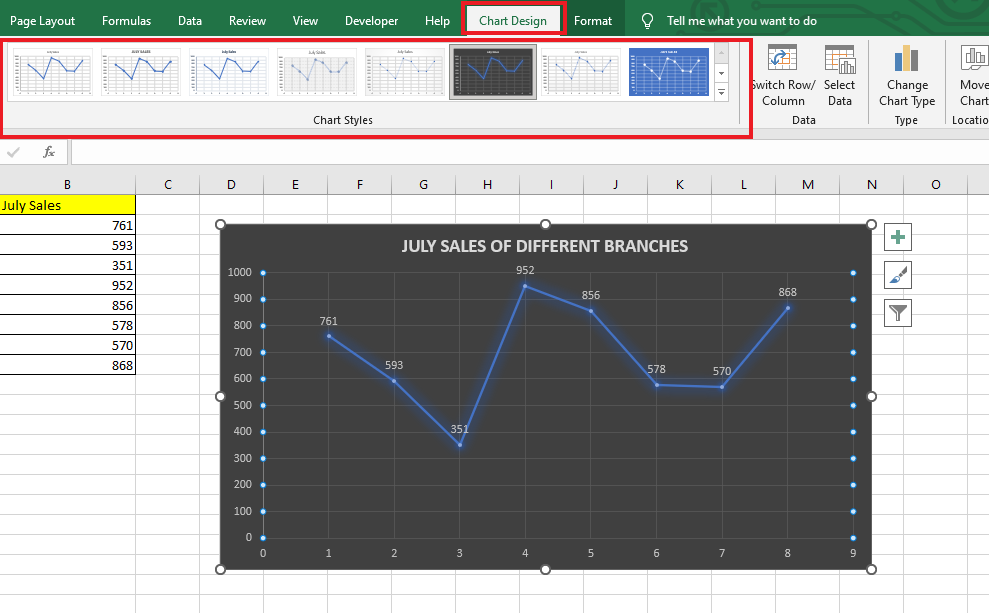
In the Chart Design Tab, choose a Chart Style to improve your data visualization.
-
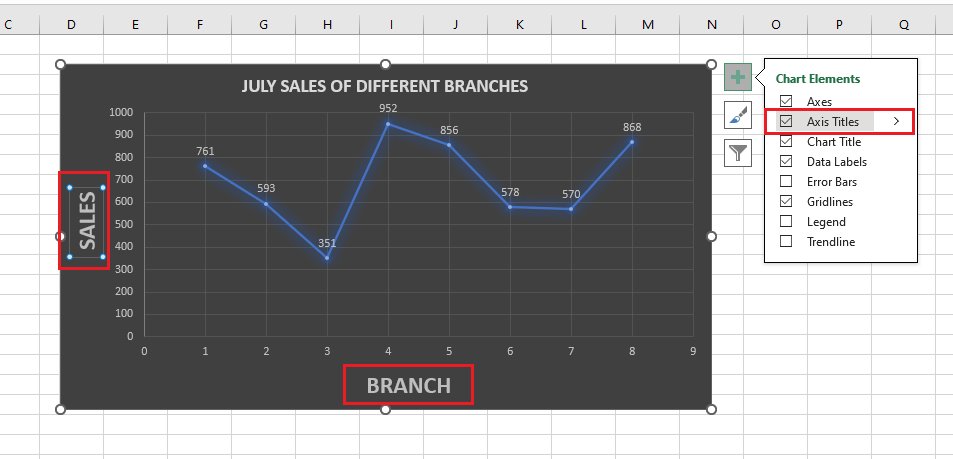
Add Axis Titles under Chart Elements.
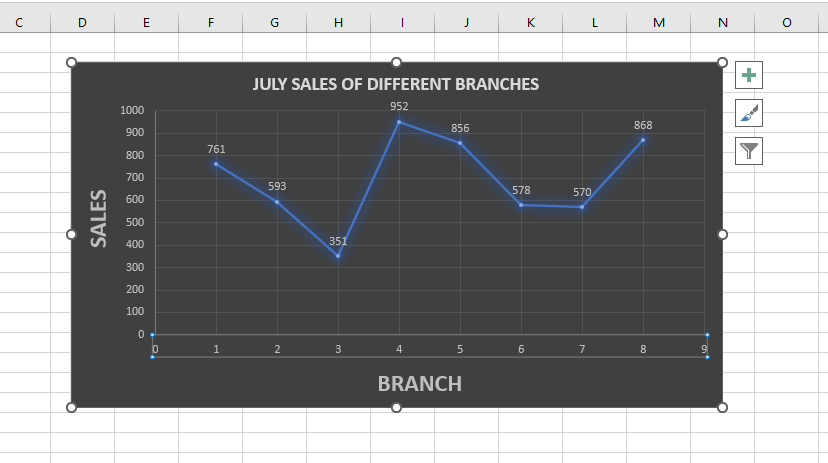
Finished Scatter Chart.
Read Also: Scatter Plot in Excel (In Easy Steps)
Final Thoughts on How to Make a Scatter Plot in Excel
In summary, creating a scatter plot in Excel is a straightforward process that can reveal valuable insights from your data. By organizing your data and customizing your chart settings, you can represent the relationships between different variables. With Excel's powerful charting tools and intuitive interface, anyone can learn how to make a scatter plot and enhance their data analysis skills.
For more easy-to-follow Excel guides, visit Simple Sheets. Get Excel and Google Sheets templates by reading the related articles below!
Frequently Asked Questions on How To Make A Scatter Plot In Excel:
Can I use a Scatter plot with three variables?
Yes. You can use Scatter Plot with three variables. However, the tool you use will determine how well the task goes.
How can I make a Scatter Plot with a time series plot in Excel?
-
Choose the time column and the data series column.
-
Then, click on the Insert ribbon.
-
Choose Scatter.
-
Pick Scatter with Smooth Lines from the scatter plot options.
How do I change the color of my Scatter Plot?
-
Go to Chart Style.
-
Click Change Colors.
-
Pick a color that you like for your graph.
Related Templates:
Scatter Diagram Excel Template
Want to Make Excel Work for You? Try out 5 Amazing Excel Templates & 5 Unique Lessons
We hate SPAM. We will never sell your information, for any reason.


