Earned Value Analysis
Excel Template

What's Inside the Earned Value Analysis Template?
Details | 5 Sheets
Supported Versions | Excel 2010, 2013, 2016, 2019, Office 365 (Mac)
Category | Project Management, Operations
Tags | PMP, Planning
Why Professionals Choose Simple Sheets
It's simple. Access to the largest library of premium Excel Templates, plus world-class training.

100+ Professional Excel Templates
Optimized for use with Excel. Solve Excel problems in minutes, not hours.

World-Class Excel University
With our university, you'll learn how we make templates & how to make your own.

How-To Videos
Each template comes with a guide to use it along with how-to videos that show how it works.
Inside Our Earned Value Analysis
Excel Template

‘How’s it going?’ is a common question among human beings. The general response is something like good or fine, usually omitting many details that would overwhelm a general question like that. However, if a colleague or boss gets a little bit more specific and asks how a certain project is going, an answer like that may not cut it.
Earned Value Analysis is a technique for project managers to quantify the performance of an ongoing project. Our Earned Value Analysis Excel Template helps you compare your Planned Value (PV) vs. Earned Value (EV) vs. Actual Cost (AC).
Before we dive into how to use our EVA Template, you may also want to check out our Make or Buy Analysis, Cost of Quality, Cost-Benefit Analysis and Capacity Planning Analysis Excel Templates. We have more than two-dozen templates designed for operators and supply chain managers.
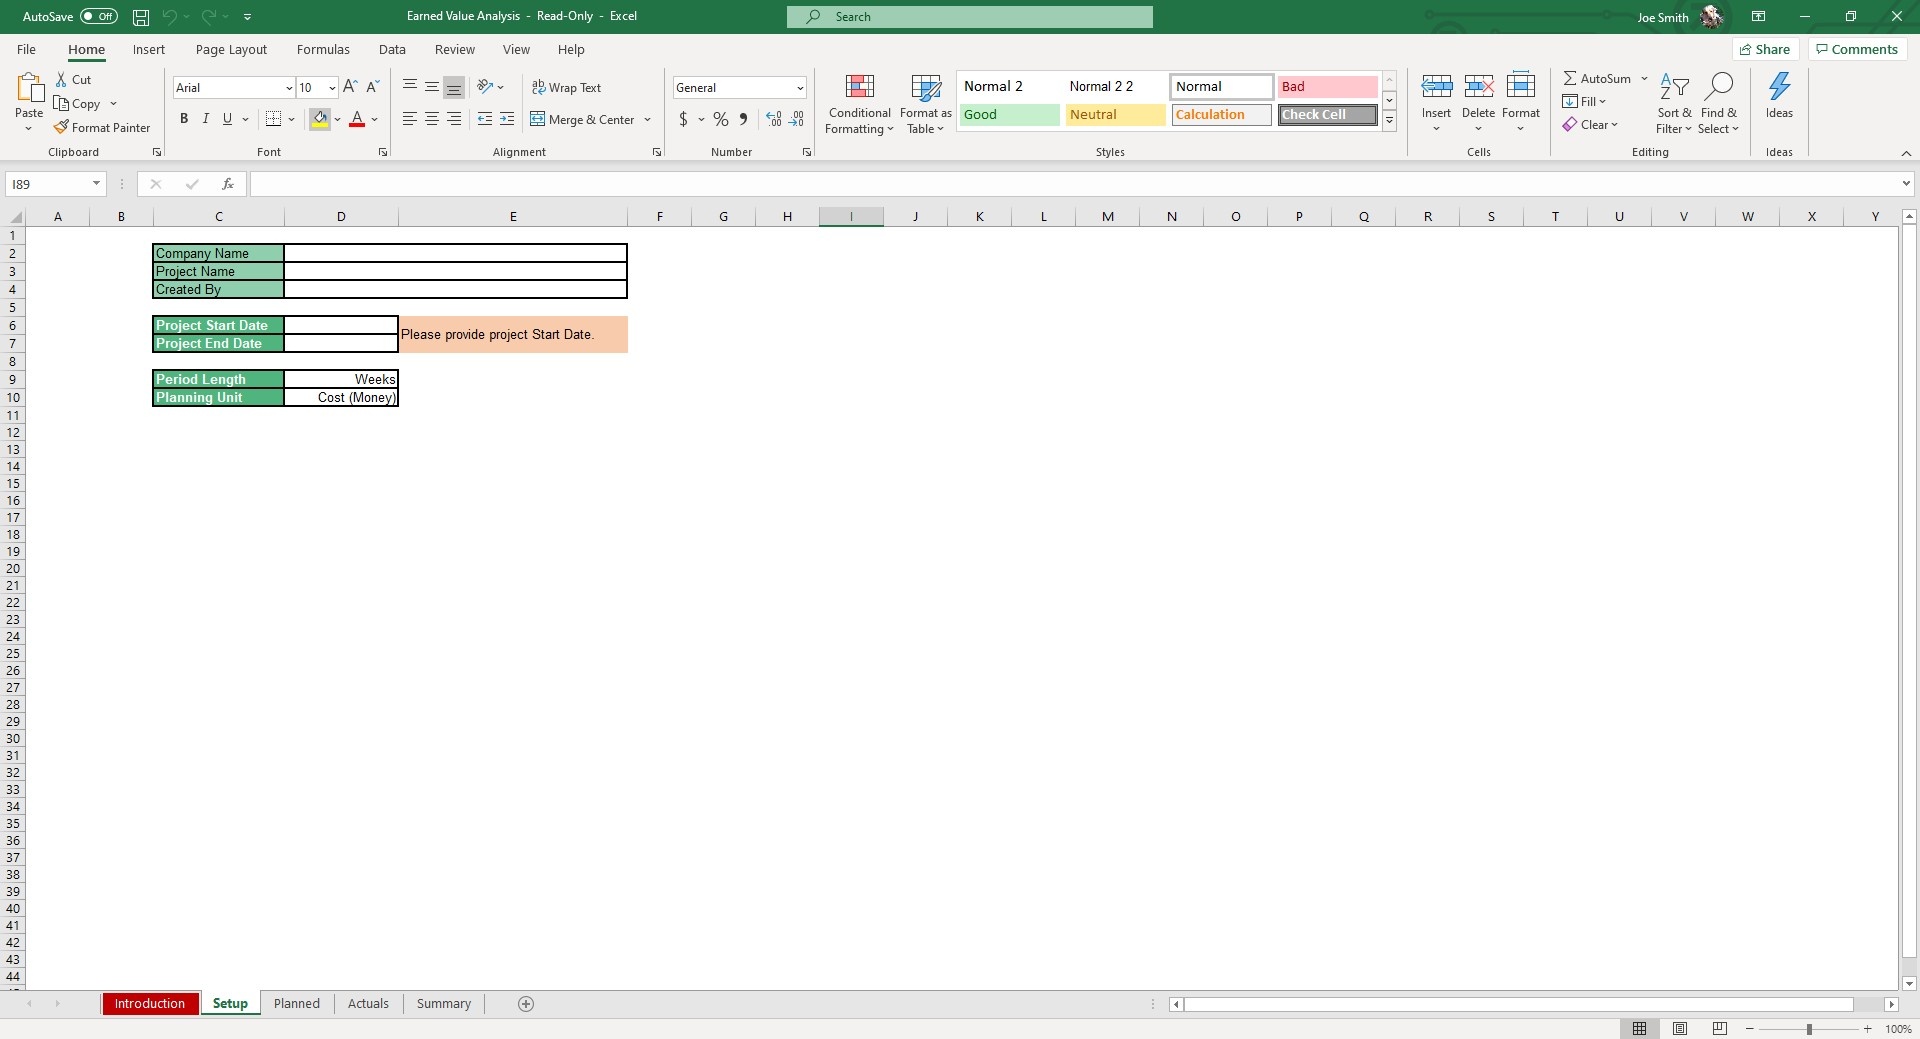
Start by opening up the Setup sheet. Enter basic information like Company Name, Project Name and Created By. This is important to fill out because it will auto populate in the Summary sheet
Input the Project Start and Project End Date. Using a dropdown menu, you can choose the Period Length (Days, Weeks, Quarters, Months, Years) and Planning Unit (Cost, Hours).
Move over to the Planned sheet and fill in all planned costs.
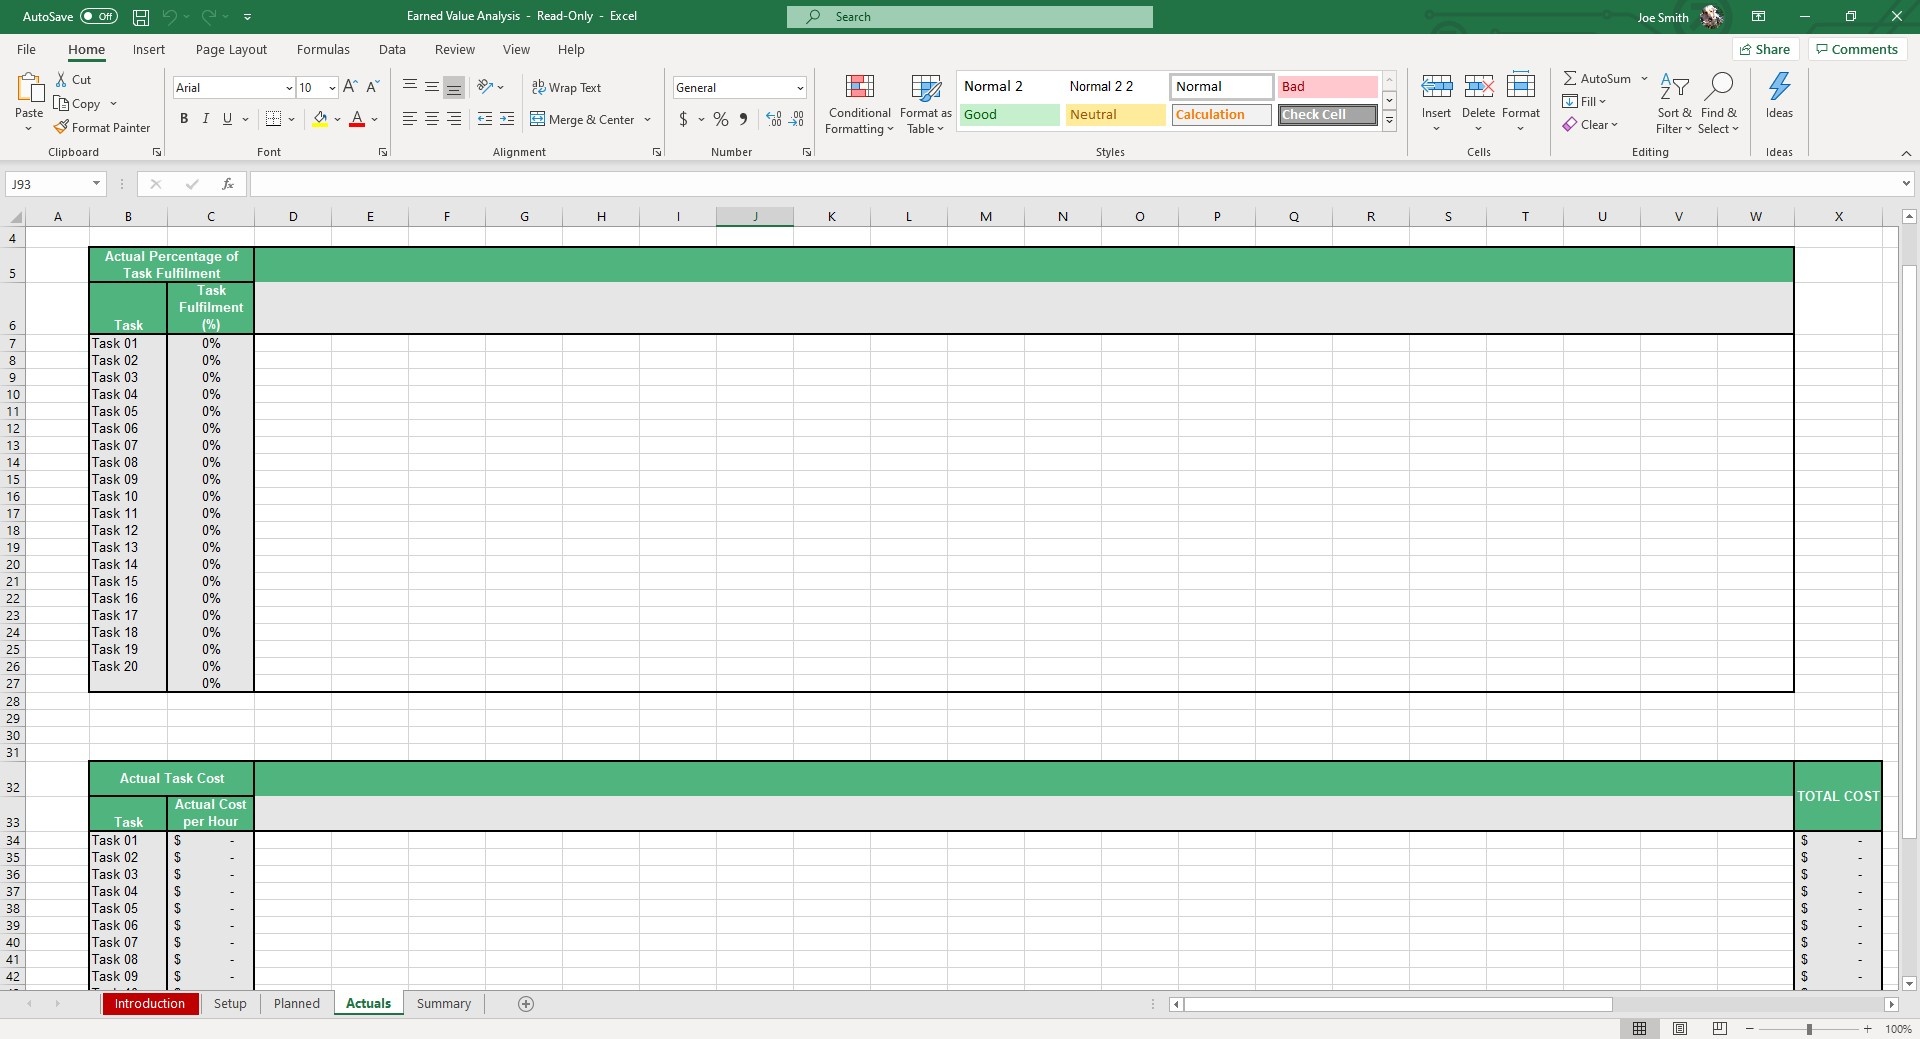
Navigate to the Actuals sheet and fill out all actual costs. The Actual Percentage of Task Fulfillment is a placeholder for the percentage of tasks completed in each period. The Actual Task Cost will reflect costs from the Planned sheet.


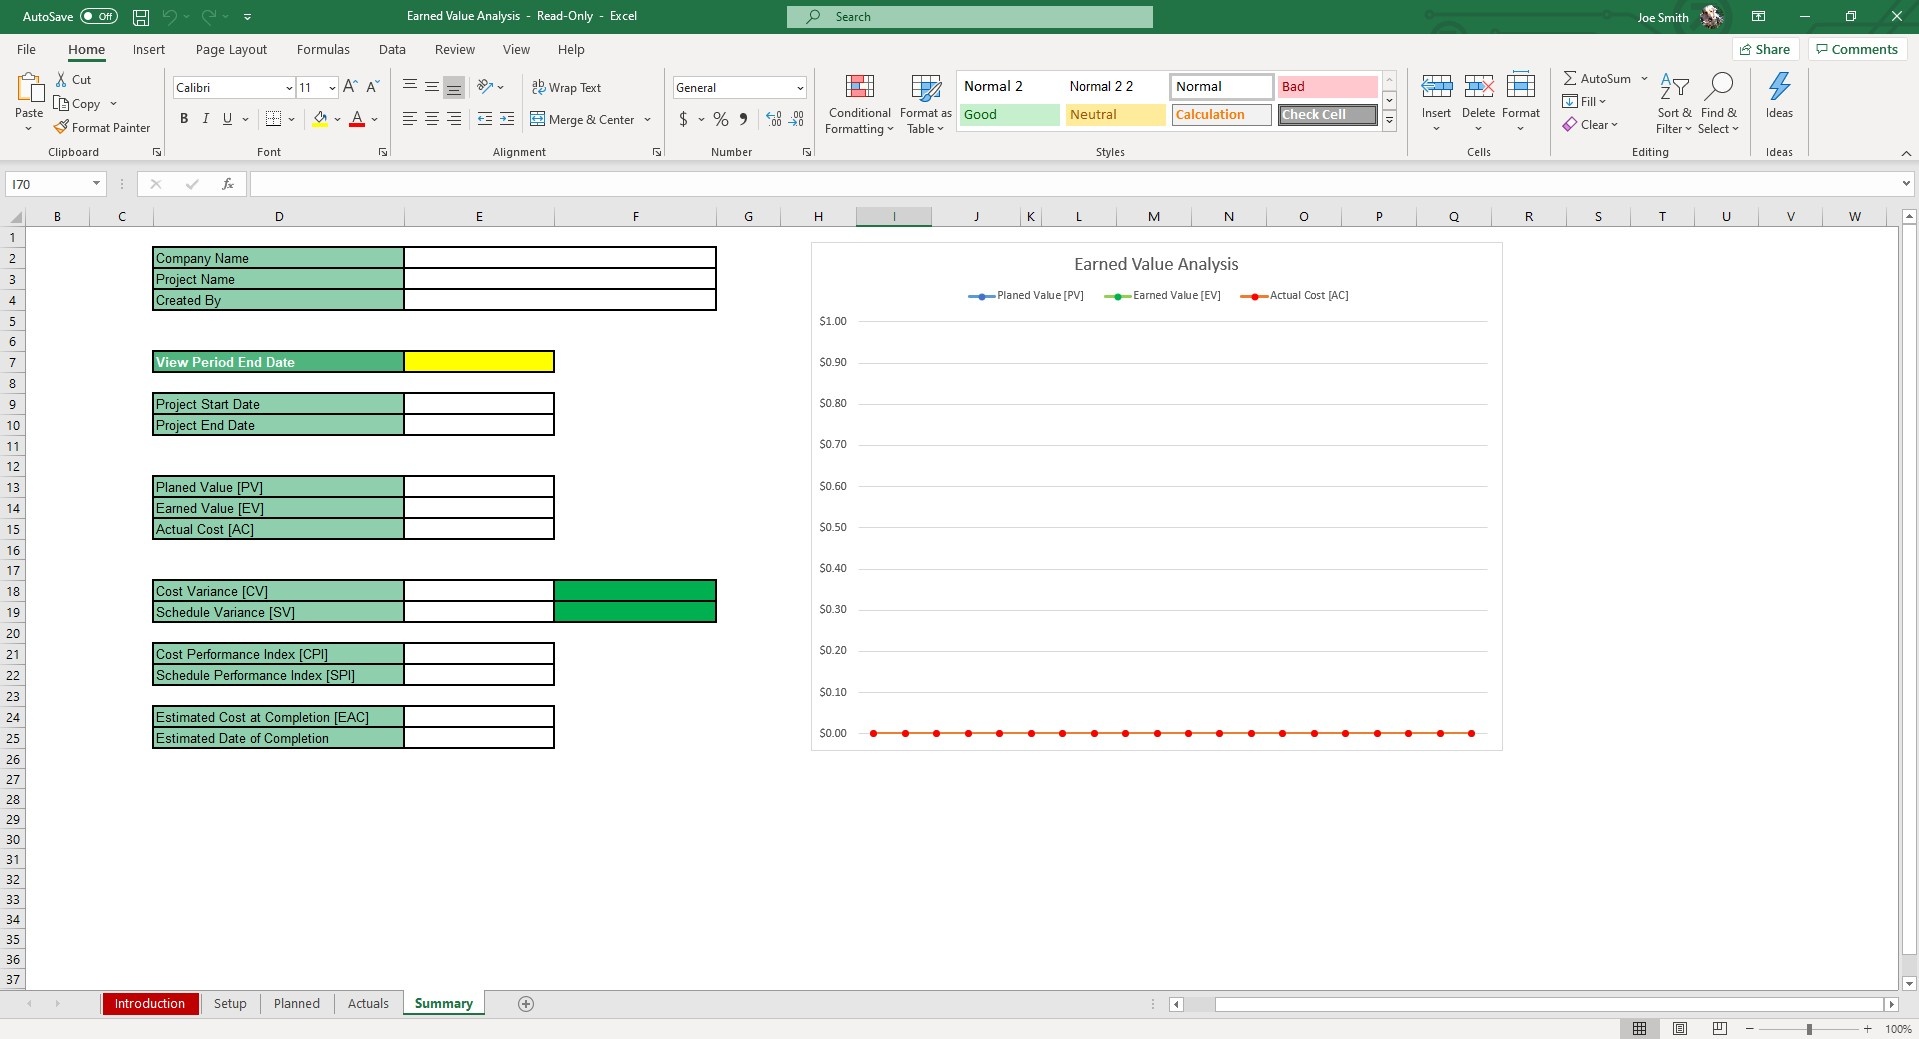
Once you’ve input all your data, hop to the Summary sheet. All your input from the prior sheets will auto populate and calculate the Planned Value, Earned Value and Actual Cost in the first table.
The second table will display the Cost Variance (CV) and Schedule Variance (SV). Below that the CPI, SPI, Estimated Cost at Completion and Estimated Date of Completion will all be calculated automatically.
You can use the dropdown menu in E7 to choose which period you want those numbers for.
On the right side of the sheet is a scatter plot diagram that will chart the PV, EV and AC.
Now, when someone asks how your project is going. Going beyond ‘good’ is the easy part with all this digestible data at your fingertips.


