Gantt Chart
Excel Template
What's Inside the Gantt Chart Template?
Details | 2 Sheets
Supported Versions | Excel 2010, 2013, 2016, 2019, Office 365 (Mac)
Category | Project Management
Tags | Bar Charts


Why Professionals Choose Simple Sheets
It's simple. Access to the largest library of premium Excel Templates, plus world-class training.

100+ Professional Excel Templates
Optimized for use with Excel. Solve Excel problems in minutes, not hours.

World-Class Excel University
With our university, you'll learn how we make templates & how to make your own.

How-To Videos
Each template comes with a guide to use it along with how-to videos that show how it works.
Inside Our Gantt Chart Excel Template

A Gantt Chart is a bar chart that illustrates a project schedule.
Whether it’s marketing, product, or sales schedule, you can keep track of your progress with a Gantt Chart.
While some people use Microsoft Project, our Gantt template is perfectly suited for Excel.
Seeing your activities from a Gantt standpoint is helpful when measuring the duration and impact of these activities as it relates to the bottom line and growth.
This is one of our easiest templates to navigate.
If you like this template, you'll also love our Kanban Board and Plan Do Check Act templates, both designed to help your team stay on task and set organizational goals.
If you like this template, you'll also want to check out our other project management templates which include a Kanban Board, Plan-Do-Check-Act and Gap Analysis.
Let's dive into how to use this spreadsheet.
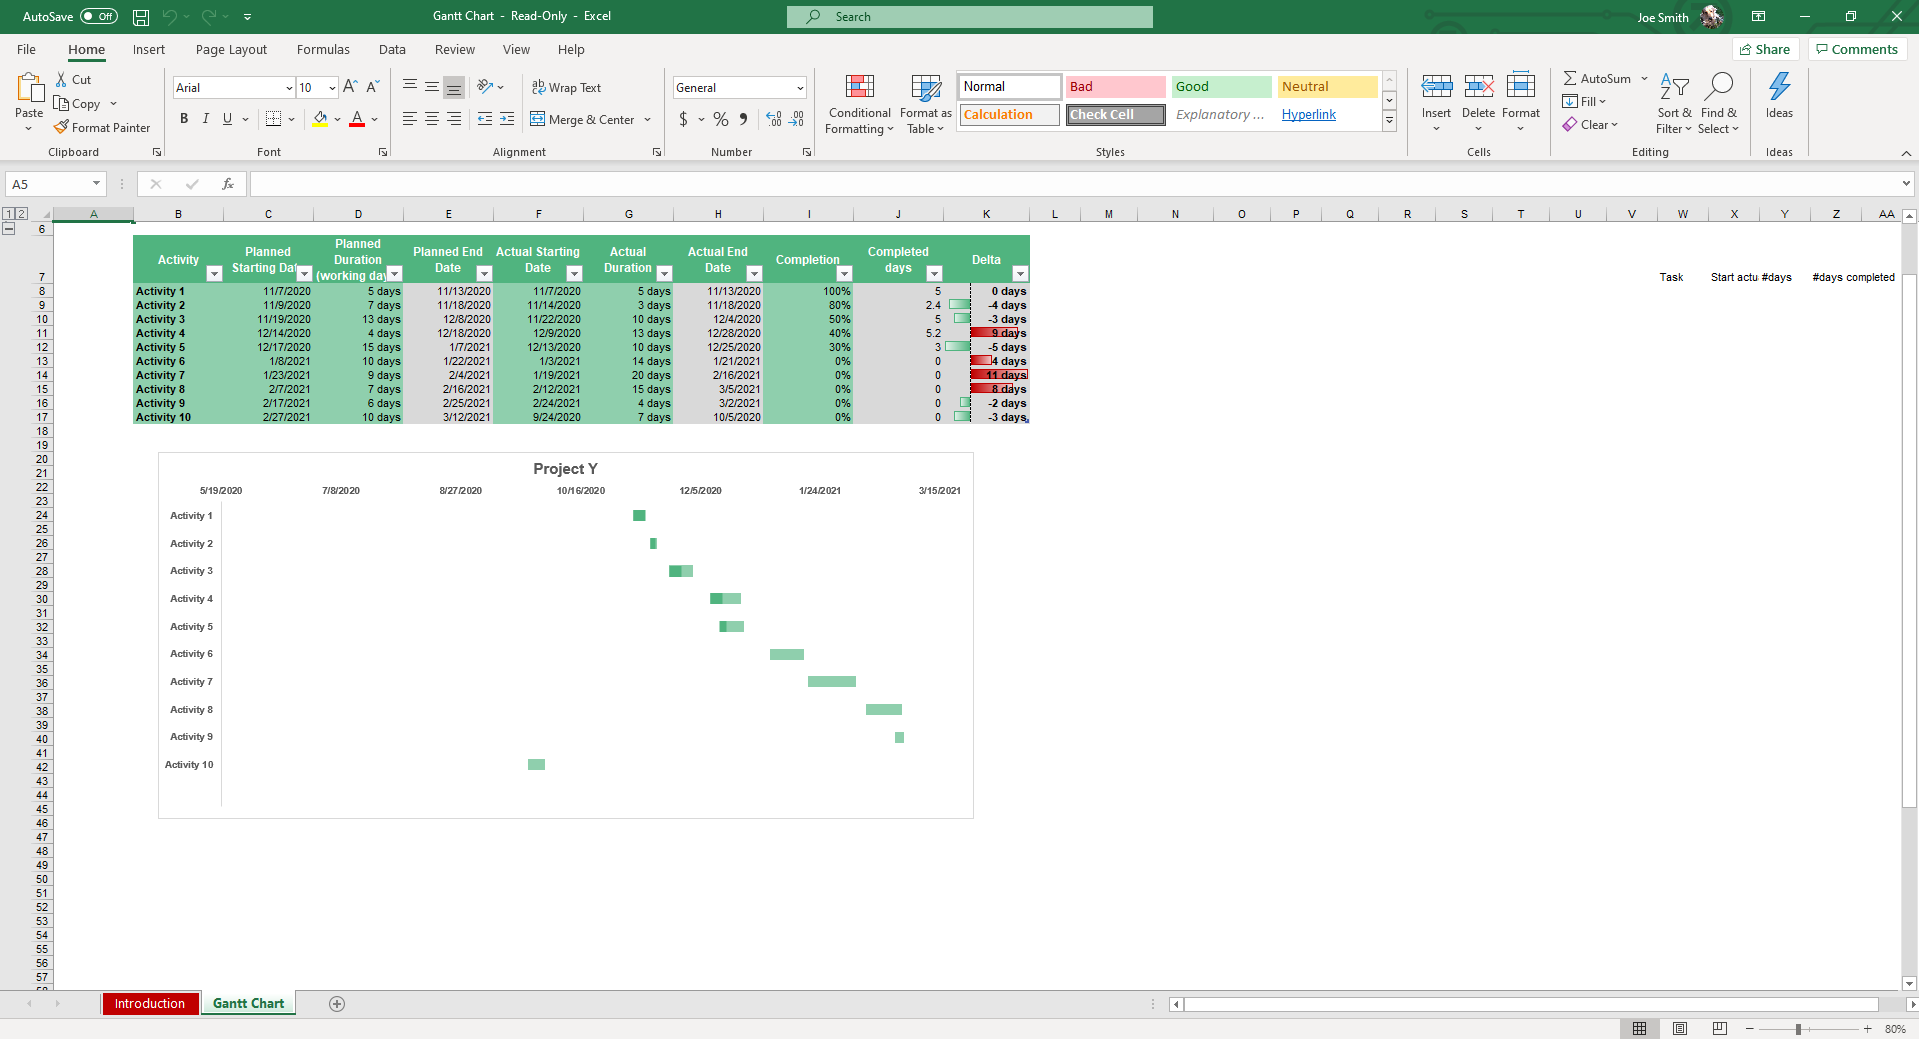
Start by entering the Project Name in cell B1. As you may use a Gantt Chart for many different activities, you want to clearly differentiate them in this cell.
Move to cell B8 which includes 10 placeholder texts for different activities you want to track. You may want to track the new advertising campaign that got the green light or a new business line the board gave the thumbs up too.
One example I like to think of, as a movie buff, is what happens once a film receives funding and starts planning to film. They start by organizing dates and setting probably timelines as to when they expect to start and when they actually start. Think of that as we continue with our instructions.
The next logical step is to set a Planned Starting Date and Planned Duration (working days). Those inputs will be used to calculate your Planned End Date, highlighted grey.
Do the same for when your Actual Starting Date and Actual Duration which will calculate your Actual End Date. Update the Completion column with the progress in terms of percentage completed.
Your Completed Days and Delta will update automatically. The Delta displays the difference between the Actual Duration and Planned Duration so you can evaluate whether you were ahead of schedule... or far behind.
Your Gantt Chart will update automatically, showing you a clear picture of your projects and timeline.


