HR Metrics Dashboard
Excel Template
What's Inside the
Employee HR Metrics Dashboard?
Details | 6 Sheets
Supported Versions (All Features) | Excel 2019, Office 365 (Mac), Power BI*
Supported Versions (Significant Features) | Excel 2013, 2016, 2019, Office 365 (Mac), Power BI*
Category | Human Resources
Tags | Payroll, KPIs, Dashboard, Salary

Why Professionals Choose Simple Sheets
It's simple. Access to the largest library of premium Excel Templates, plus world-class training.

100+ Professional Excel Templates
Optimized for use with Excel. Solve Excel problems in minutes, not hours.

World-Class Excel University
With our university, you'll learn how we make templates & how to make your own.

How-To Videos
Each template comes with a guide to use it along with how-to videos that show how it works.
Inside Our HR Metrics Excel Dashboard
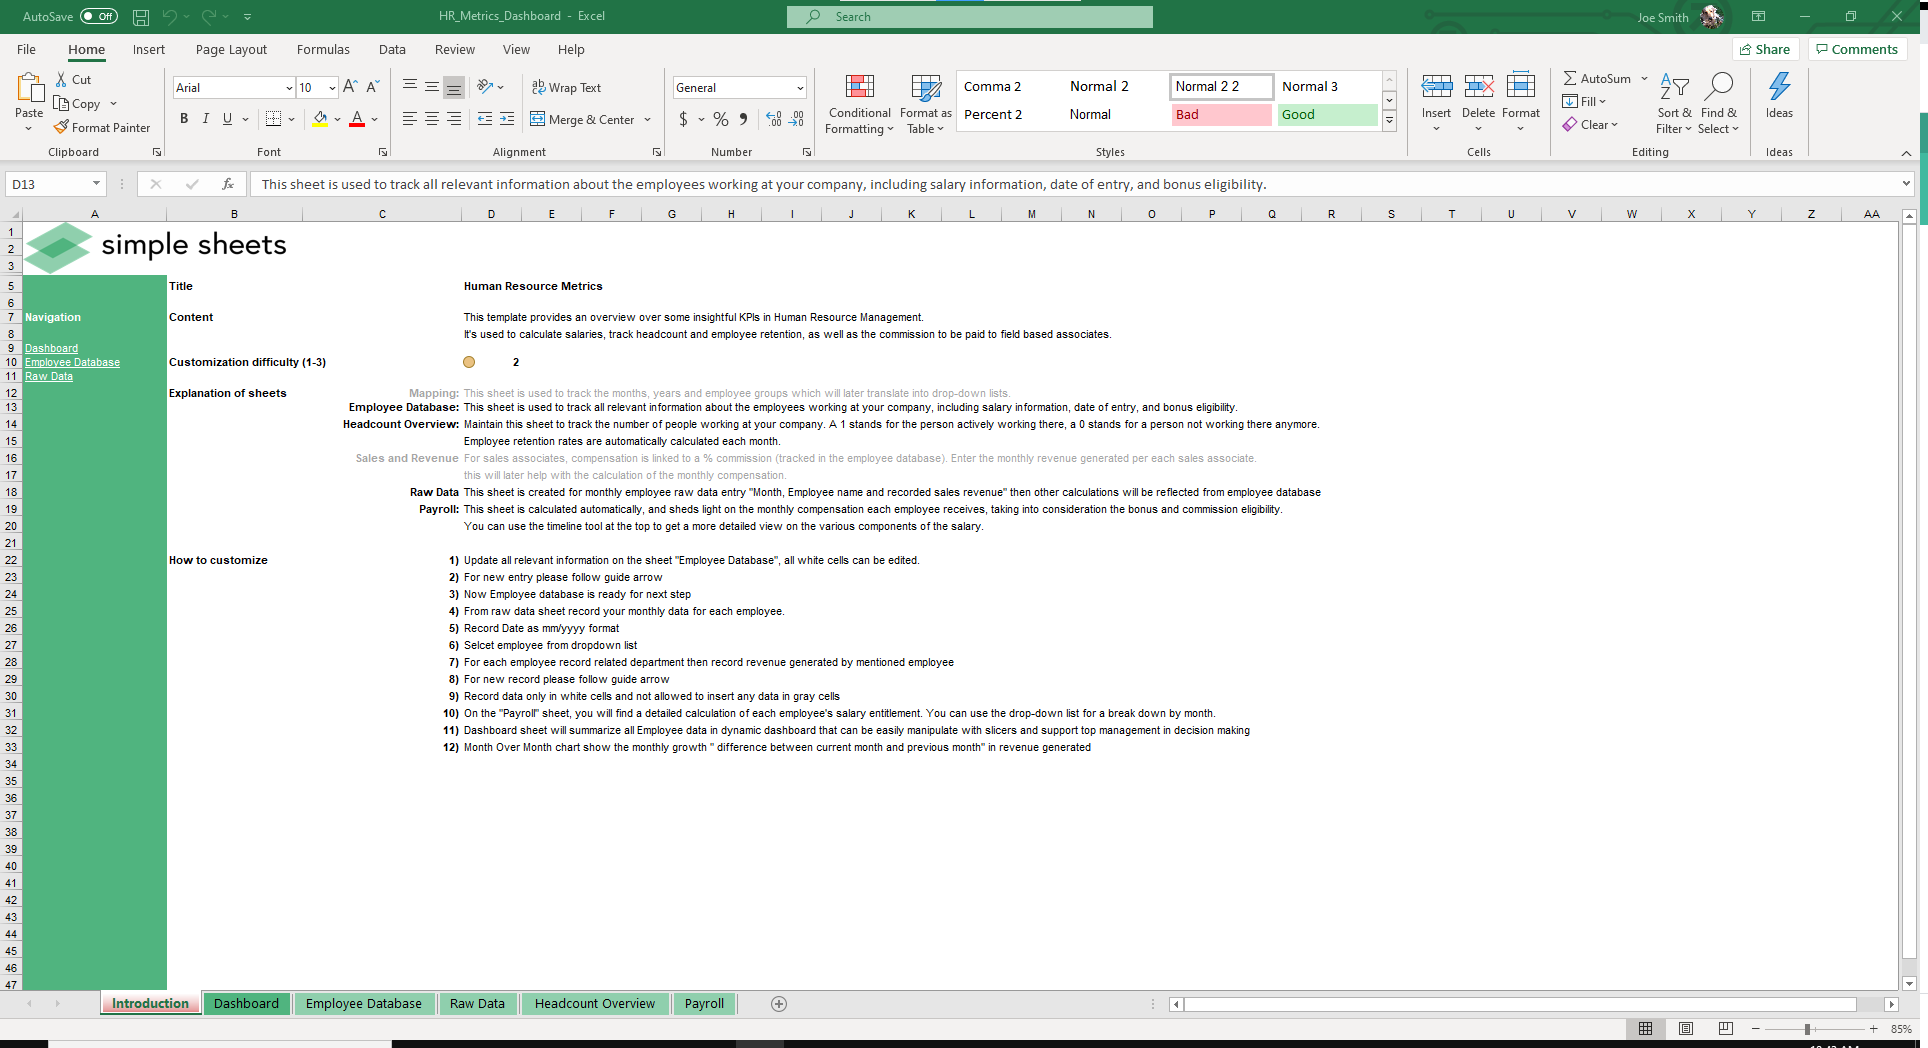
The most important part of any business is the people. Creating an environment where employees feel known and taken care of is a key ingredient to every successful venture.
This is where our HR Metrics Dashboard Excel Template comes in handy. Automate, organize, track and calculate salaries, headcount, employee retention and commission payments with this template. These human resource KPIs give you and your team valuable insights into how your organization is managing people.
Before we dive into how to use this spreadsheet, we also recommend checking out other HR-related templates like Employee Appraisal, Organizational Chart, Time Management System, Employee Scheduling and more. Excel is one of the best systems for managing your HR tasks and with these templates, you’ll have access to everything you need to operate a world-class org.
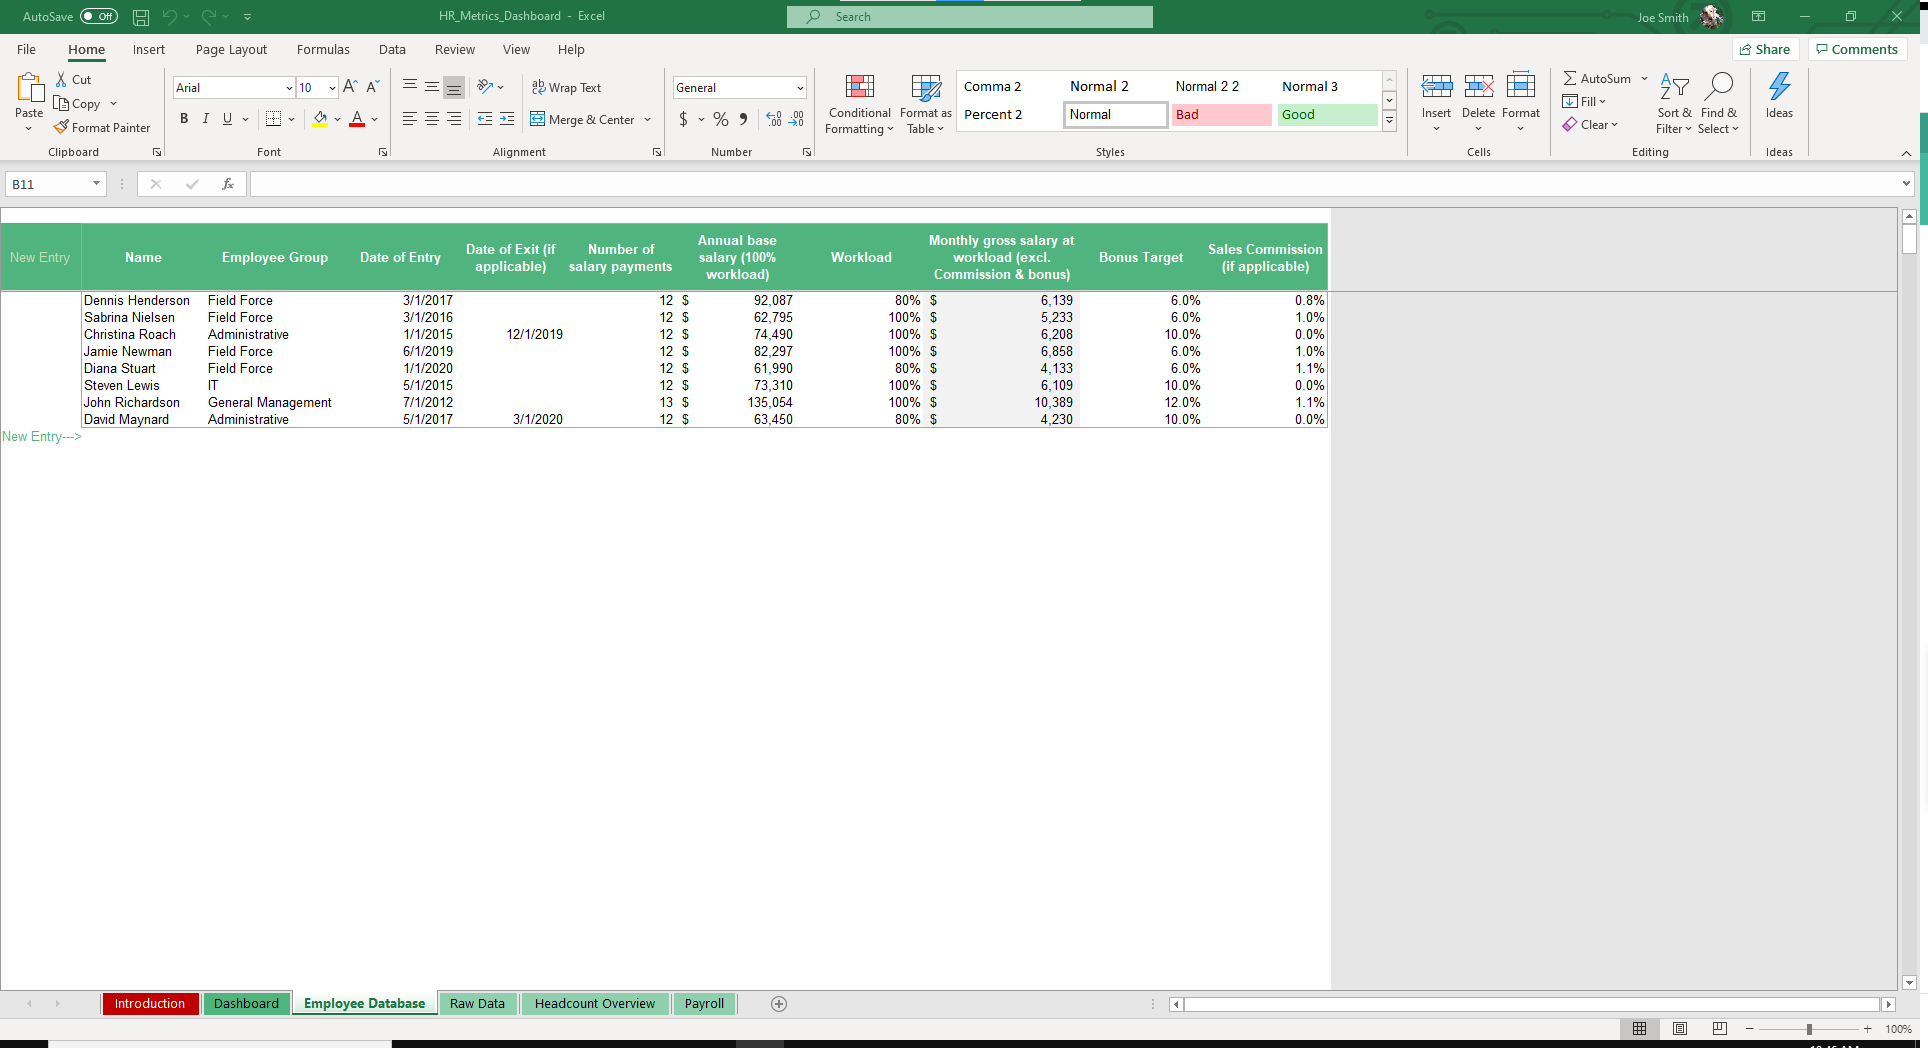
Start off by entering employee information in the Employee Database sheet. Fields include Name, Department, Start Date, Date of Exit (if applicable), Salary, Workload, Bonus Target and Sales Commission (if applicable).
Because sales commission is a field in this template, it’s especially useful for orgs that manage sales staff and track commissions.
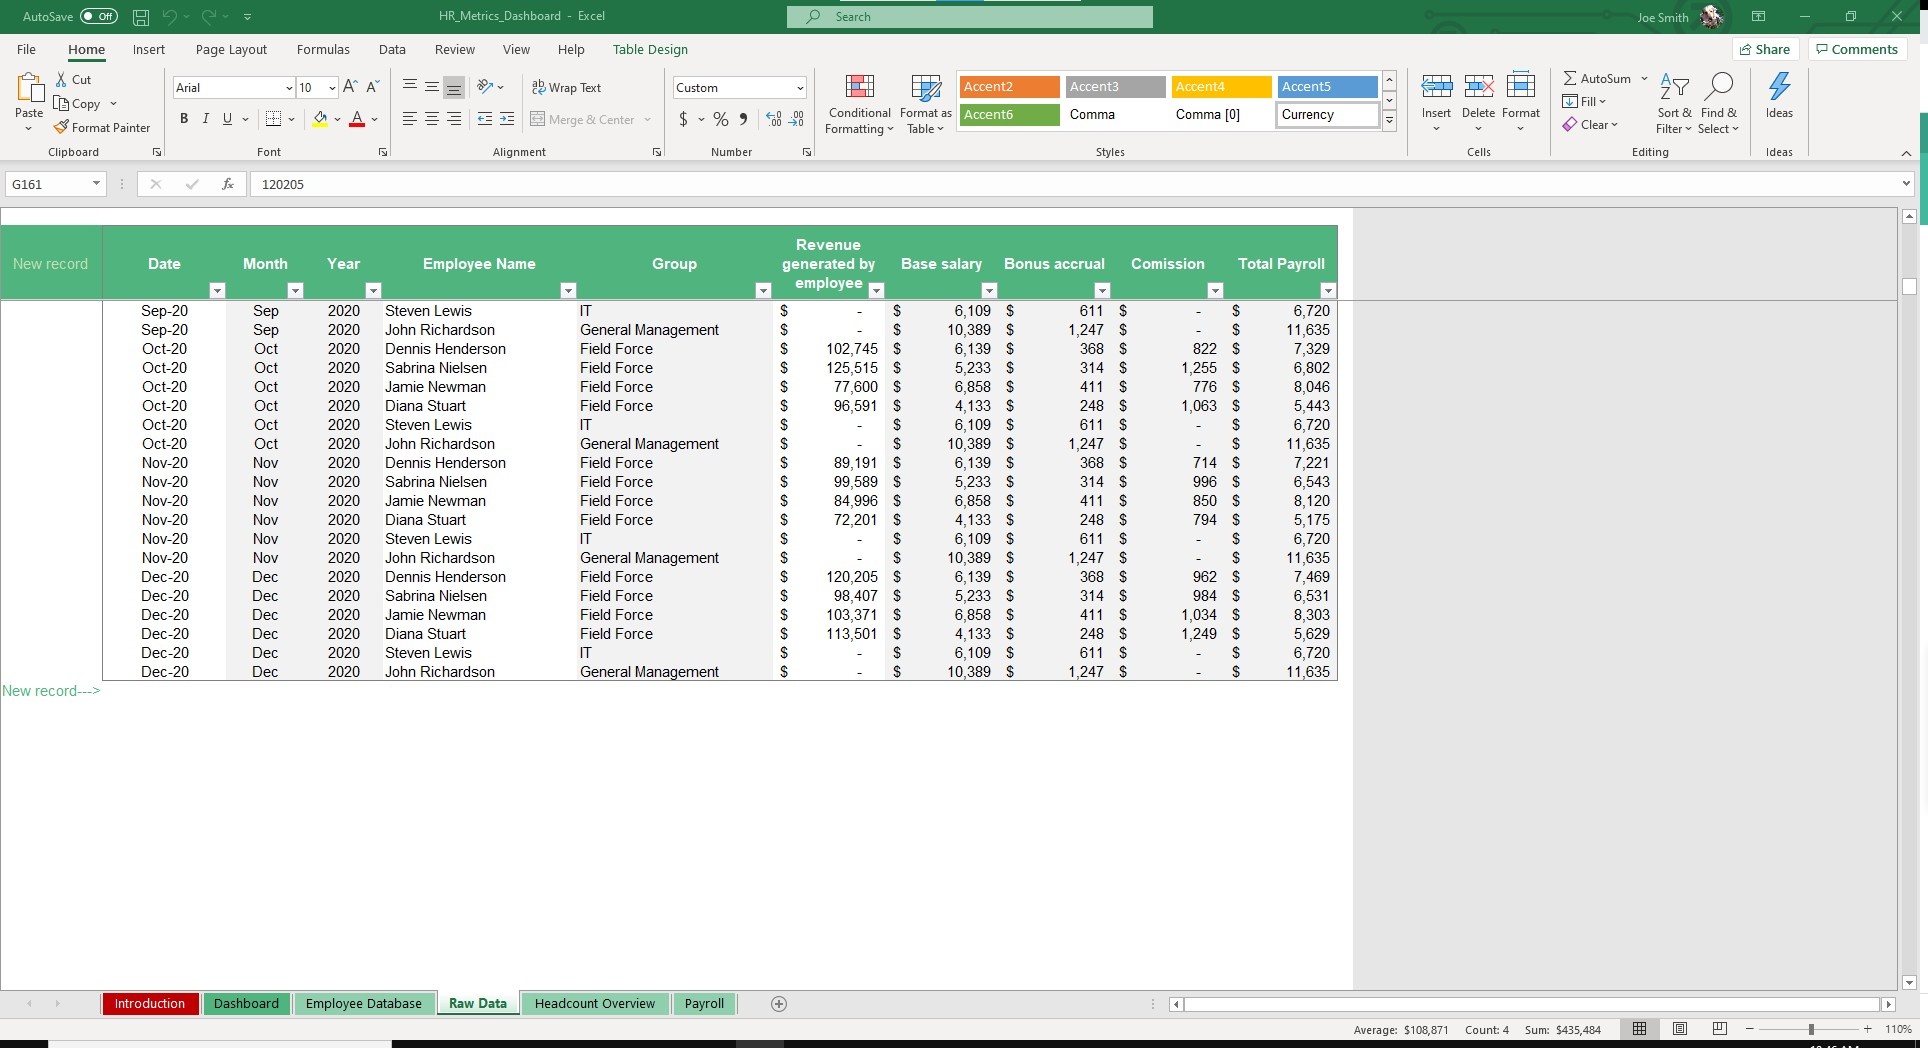
Move over to the Raw Data sheet and input commission-related data like Revenue Generated by Employee.
Grey cells like Base Salary, Bonus Accrual, Commission and Total Payroll will auto populate based on previously entered data.
Continue to update those fields as necessary and with time.
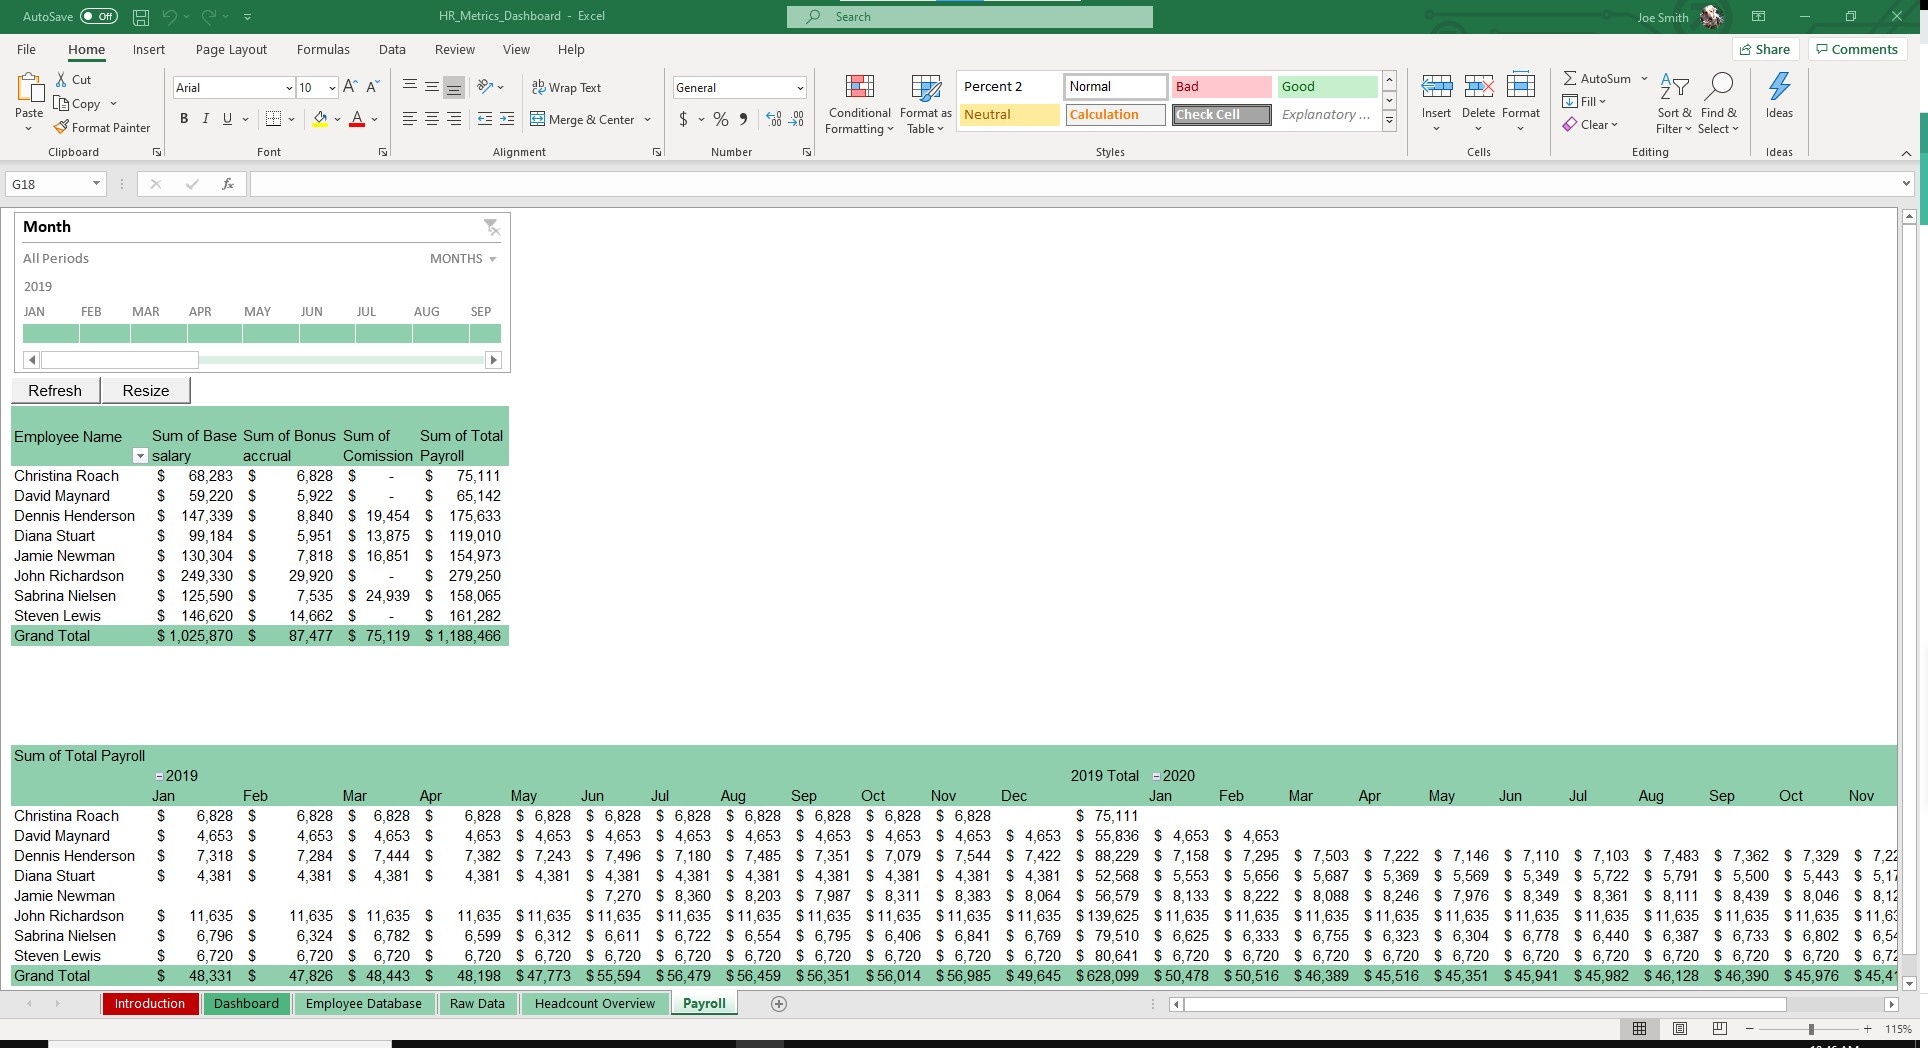

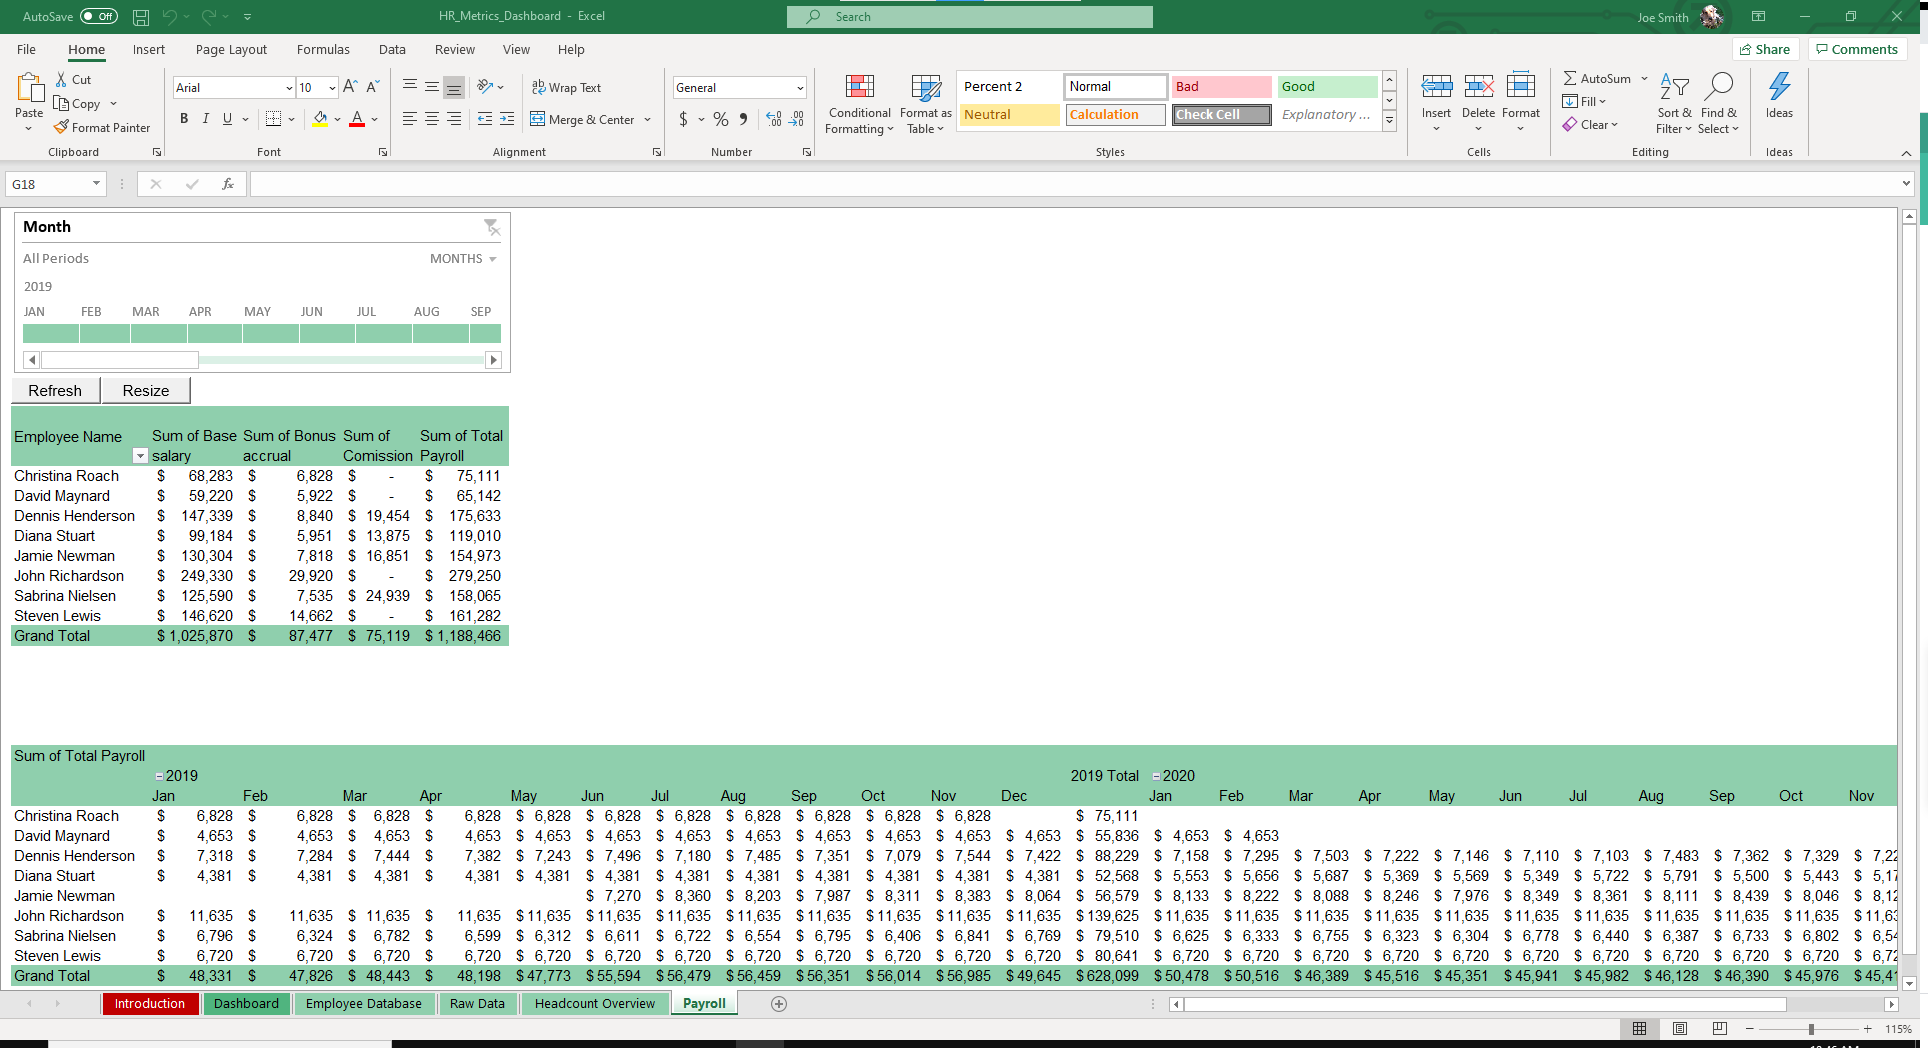
Navigate to the Payroll sheet. Like magic (okay, formulas) Payroll will be visible for each employee and time period. This sheet provides for easy filtering and sorting so accessing prior data is simple.
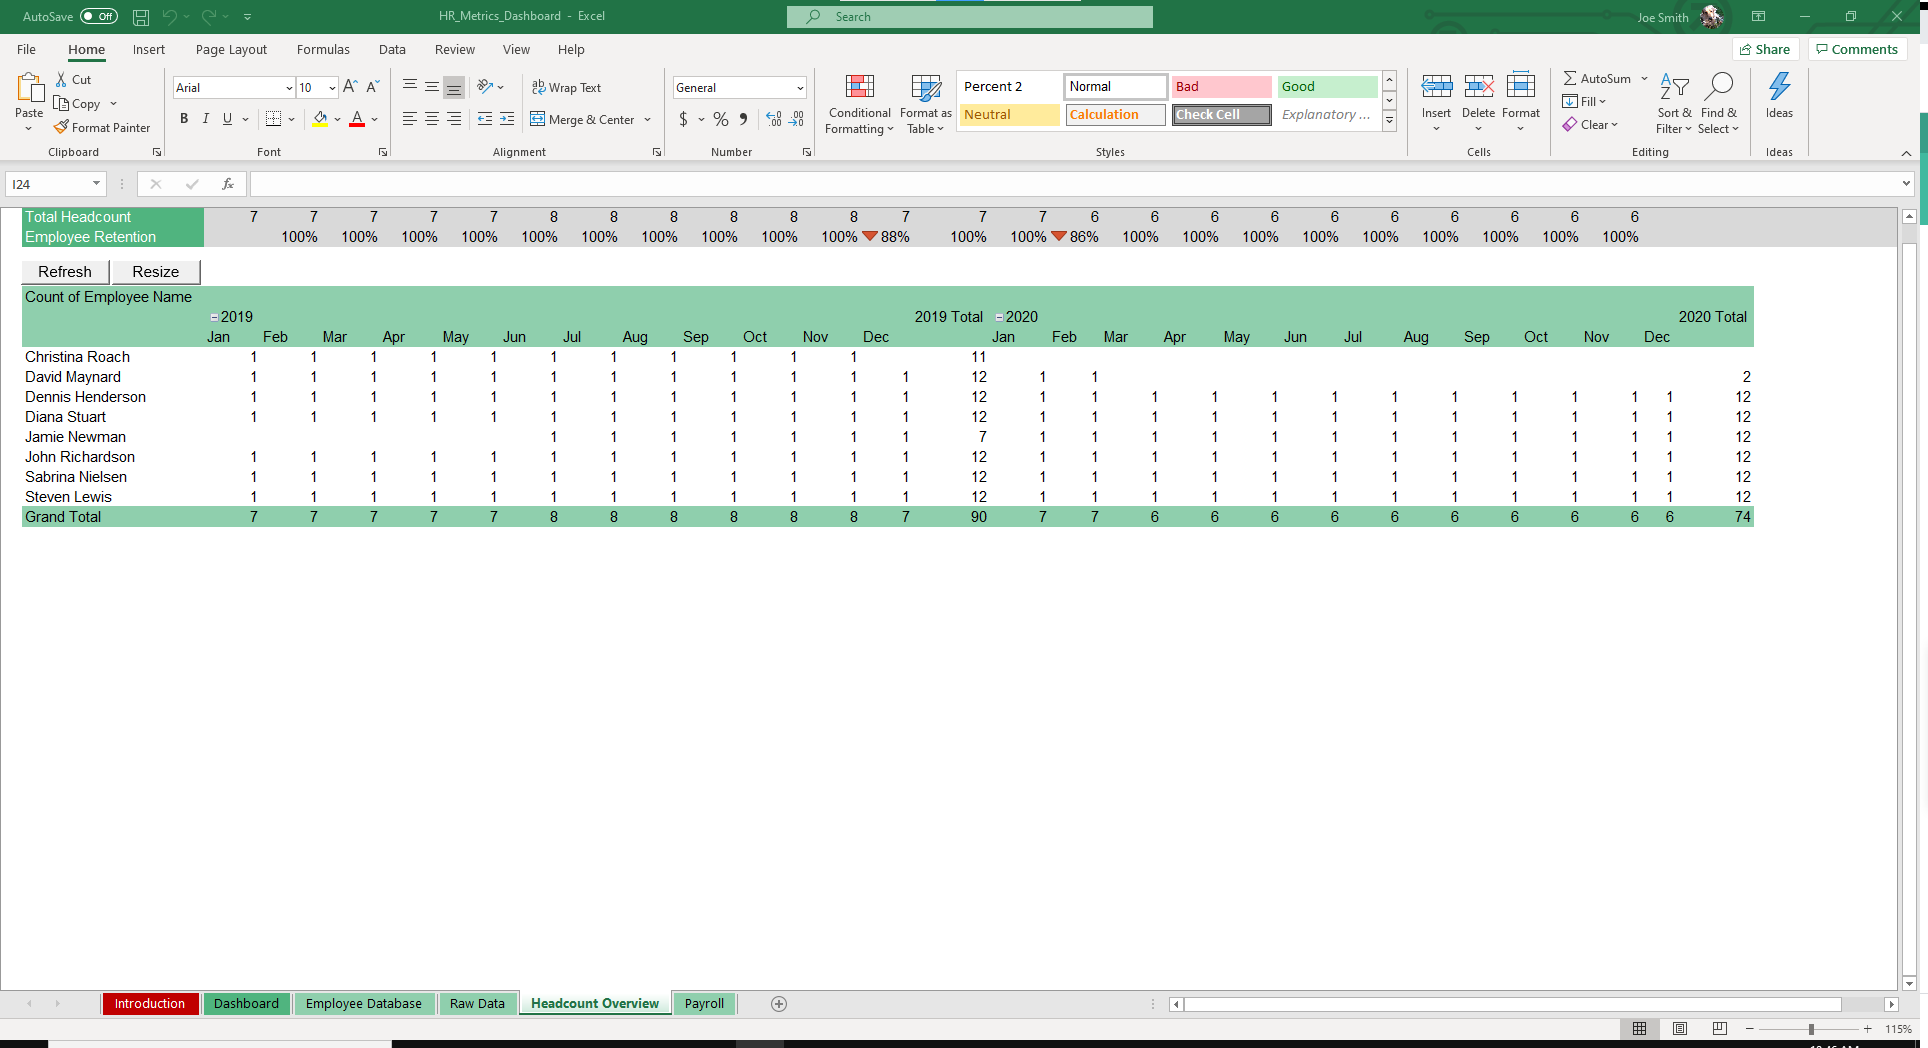
The Headcount Overview will also update based on your data.
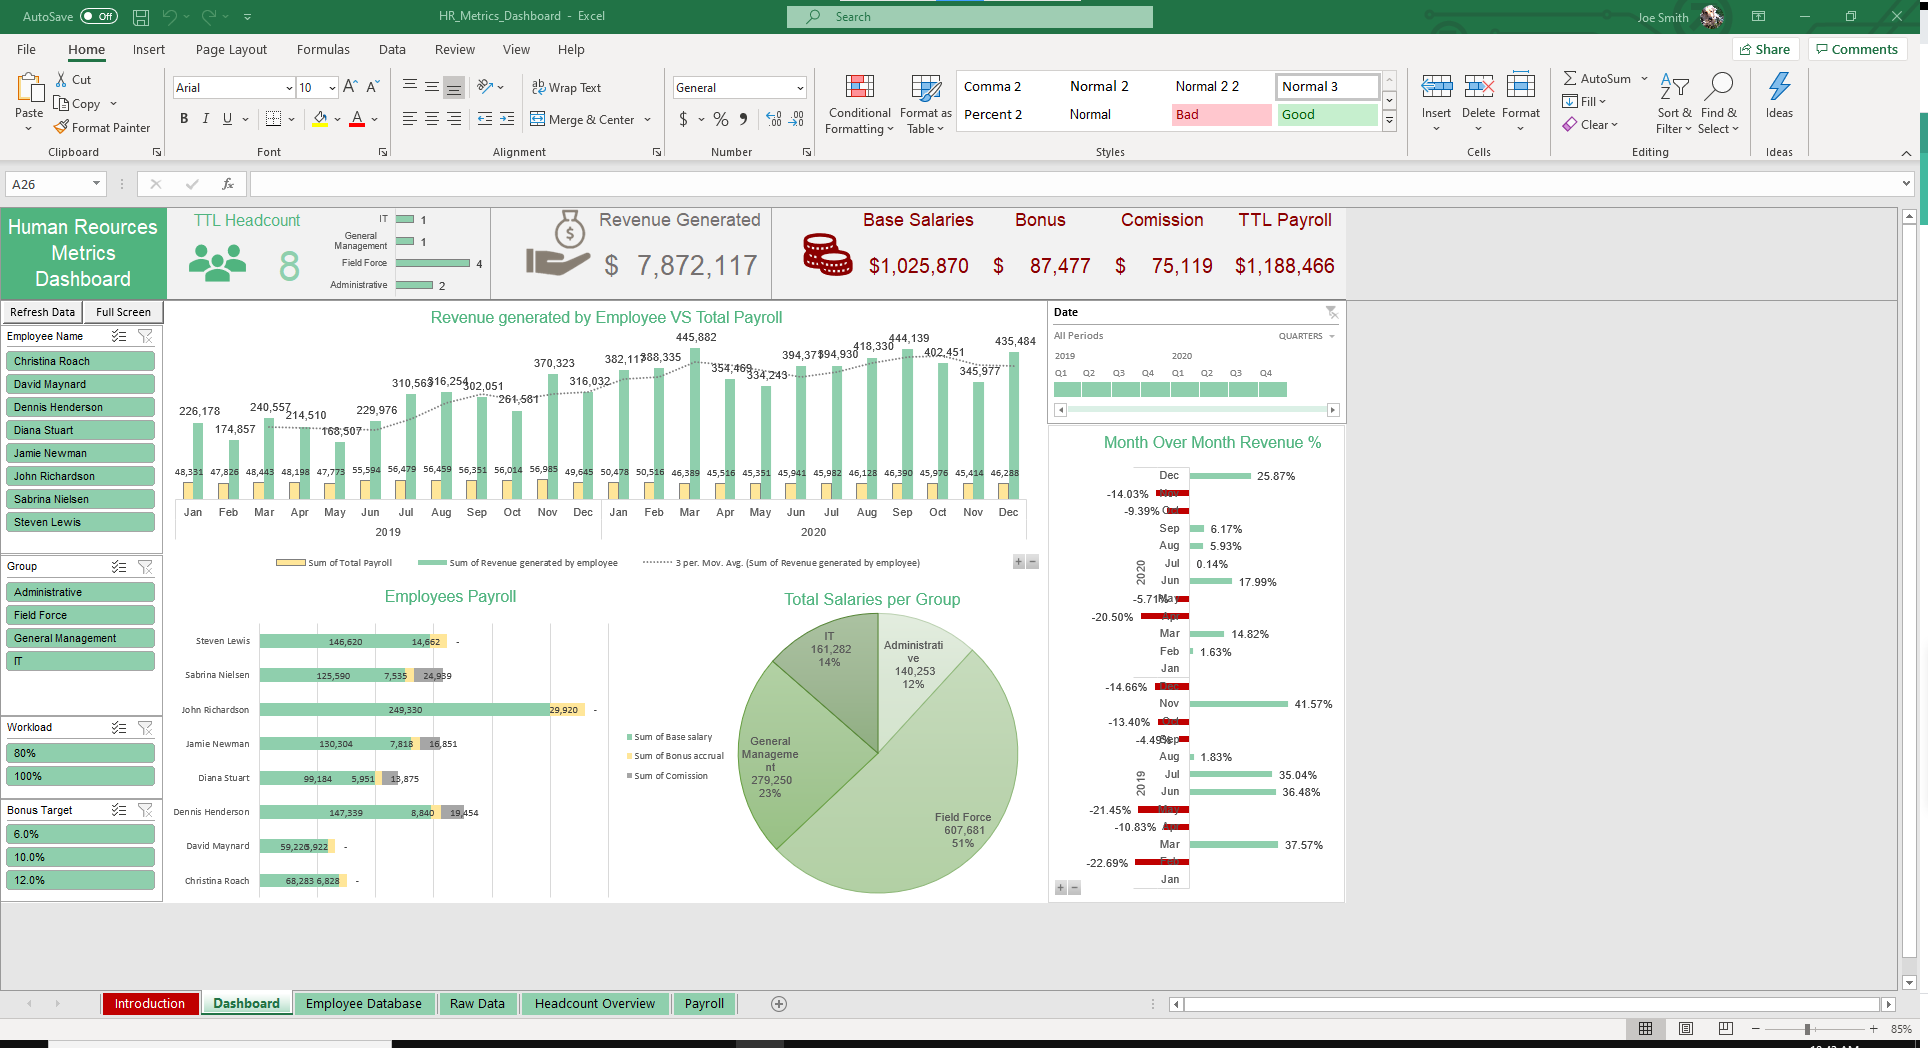
Last but not least is the Dashboard, a 10,000 foot view of HR KPIs.
View graphs, charts and insights into Revenue Generated by Employee vs Total Payroll, Total Salaries by Department, Month over Month Revenue and Employee Payroll. Adjust the time period in the Date box on the right-hand side of the sheet.
While we build most of our Excel templates with dynamic dashboards, Power BI is a Microsoft tool that allows for even greater visualization and customization.
We've paired our HR Metrics spreadsheet with a Power BI compatible dashboard that gives you further capabilities for filtering and analyzing your data.
Using Power BI, you have even greater detail and visualization for identifying KPIs as it relates to salary, compensation, payroll and employee details.
*Power BI templates are only available for Mastermind Members.


