Objectives and Key Results
Excel Template
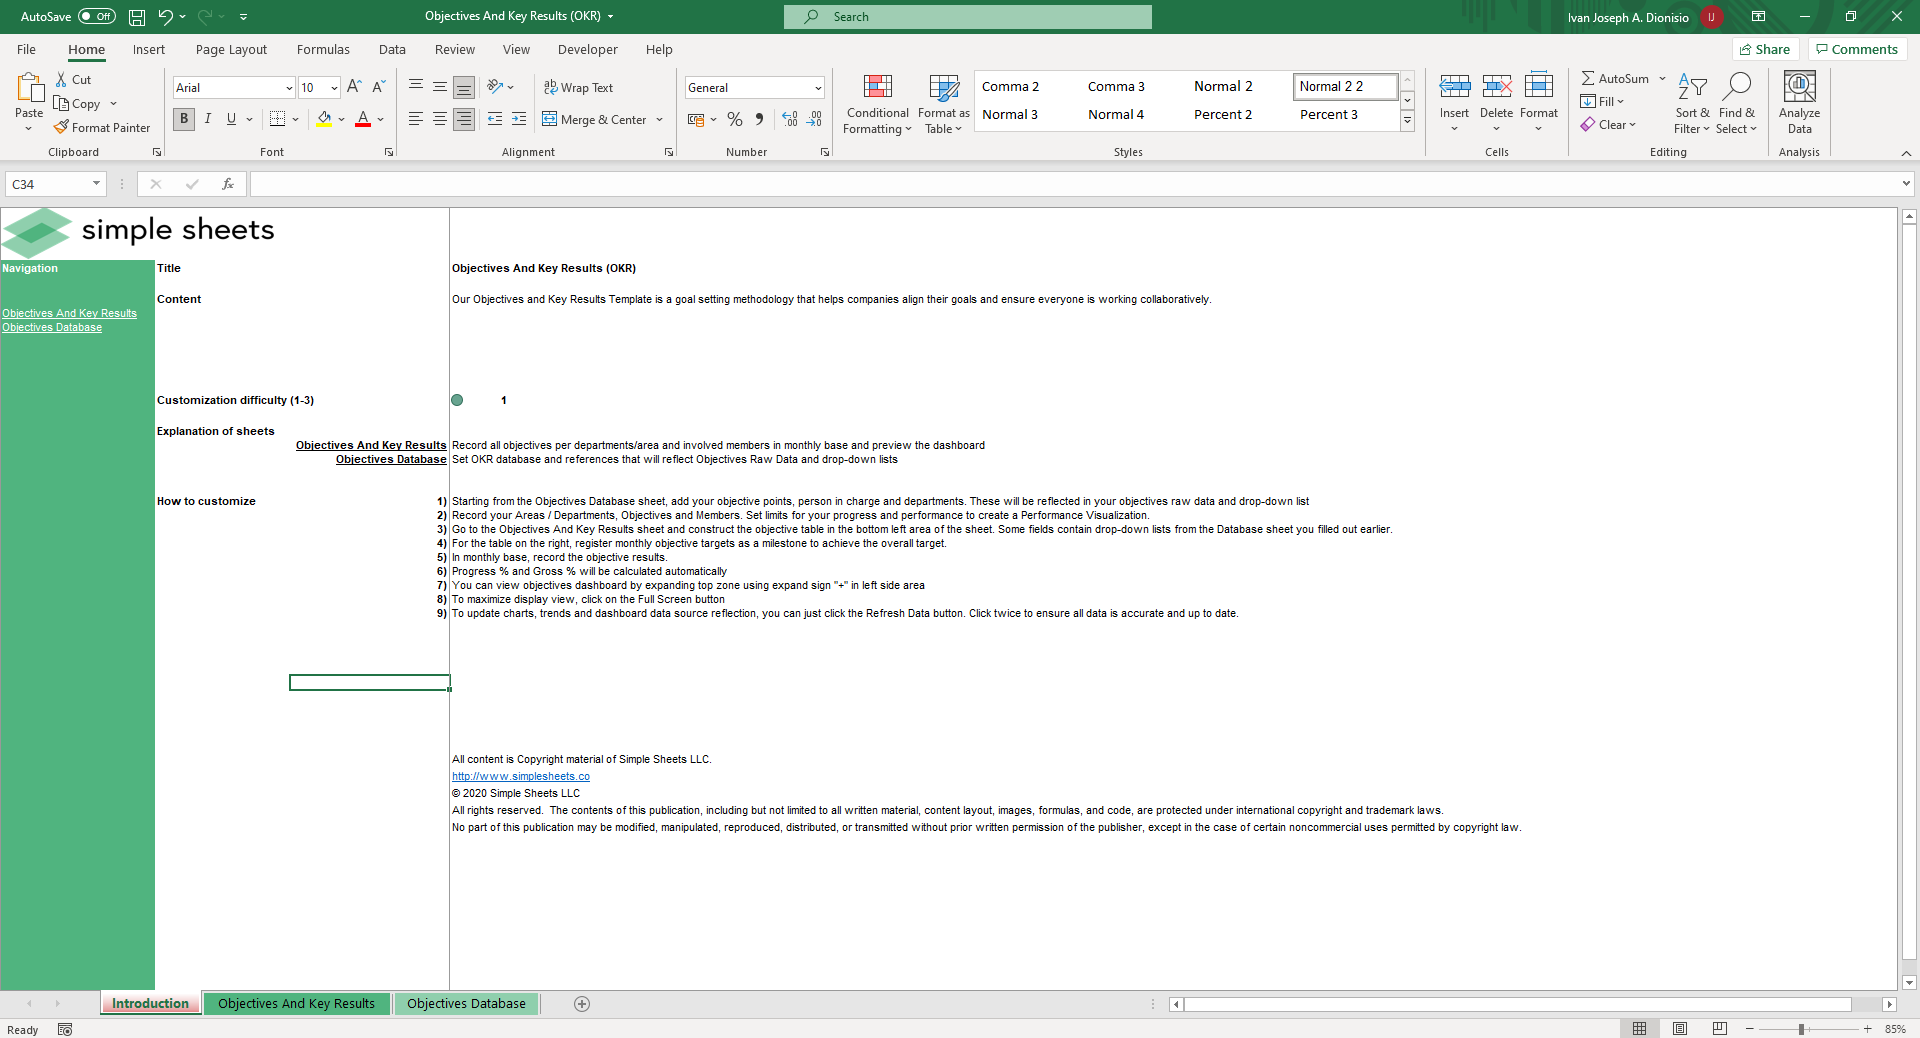
What's Inside the Objectives and Key Results Template?
Details | 3 Sheets
Supported Versions | Excel 2010, 2013, 2016, 2019, Office 365 (Mac)
Category | Management & Strategy
Tags | Objectives, OKR, Tracker
Why Professionals Choose Simple Sheets
It's simple. Access to the largest library of premium Excel Templates, plus world-class training.

100+ Professional Excel Templates
Optimized for use with Excel. Solve Excel problems in minutes, not hours.

World-Class Excel University
With our university, you'll learn how we make templates & how to make your own.

How-To Videos
Each template comes with a guide to use it along with how-to videos that show how it works.
Inside Our Objectives and Key Results
Excel Template
Leading a business takes a little more than following a magic star. Businesses and organizations constantly need to set goals and make its way towards them by accomplishing their objectives. But working towards those objectives is a daily process over, potentially, a long period of time. It can be tedious keeping up with how you're tracking.
With our Objectives and Key Results Excel Template it doesn’t have to be! See how on track your organization is towards reaching your objectives and goals with our pre-built Excel template. Want to know which departments are on track to achieve your company’s objectives? Want to see your objective progress against your overall achieved progress? This template has got you covered.
Before we dive into how we can make use of this template, be sure to check out our other strategy and management templates such as our Business Valuation, Flow Chart Diagram, and Gap Analysis Excel templates. These will you understand your company's value, processes and gaps.
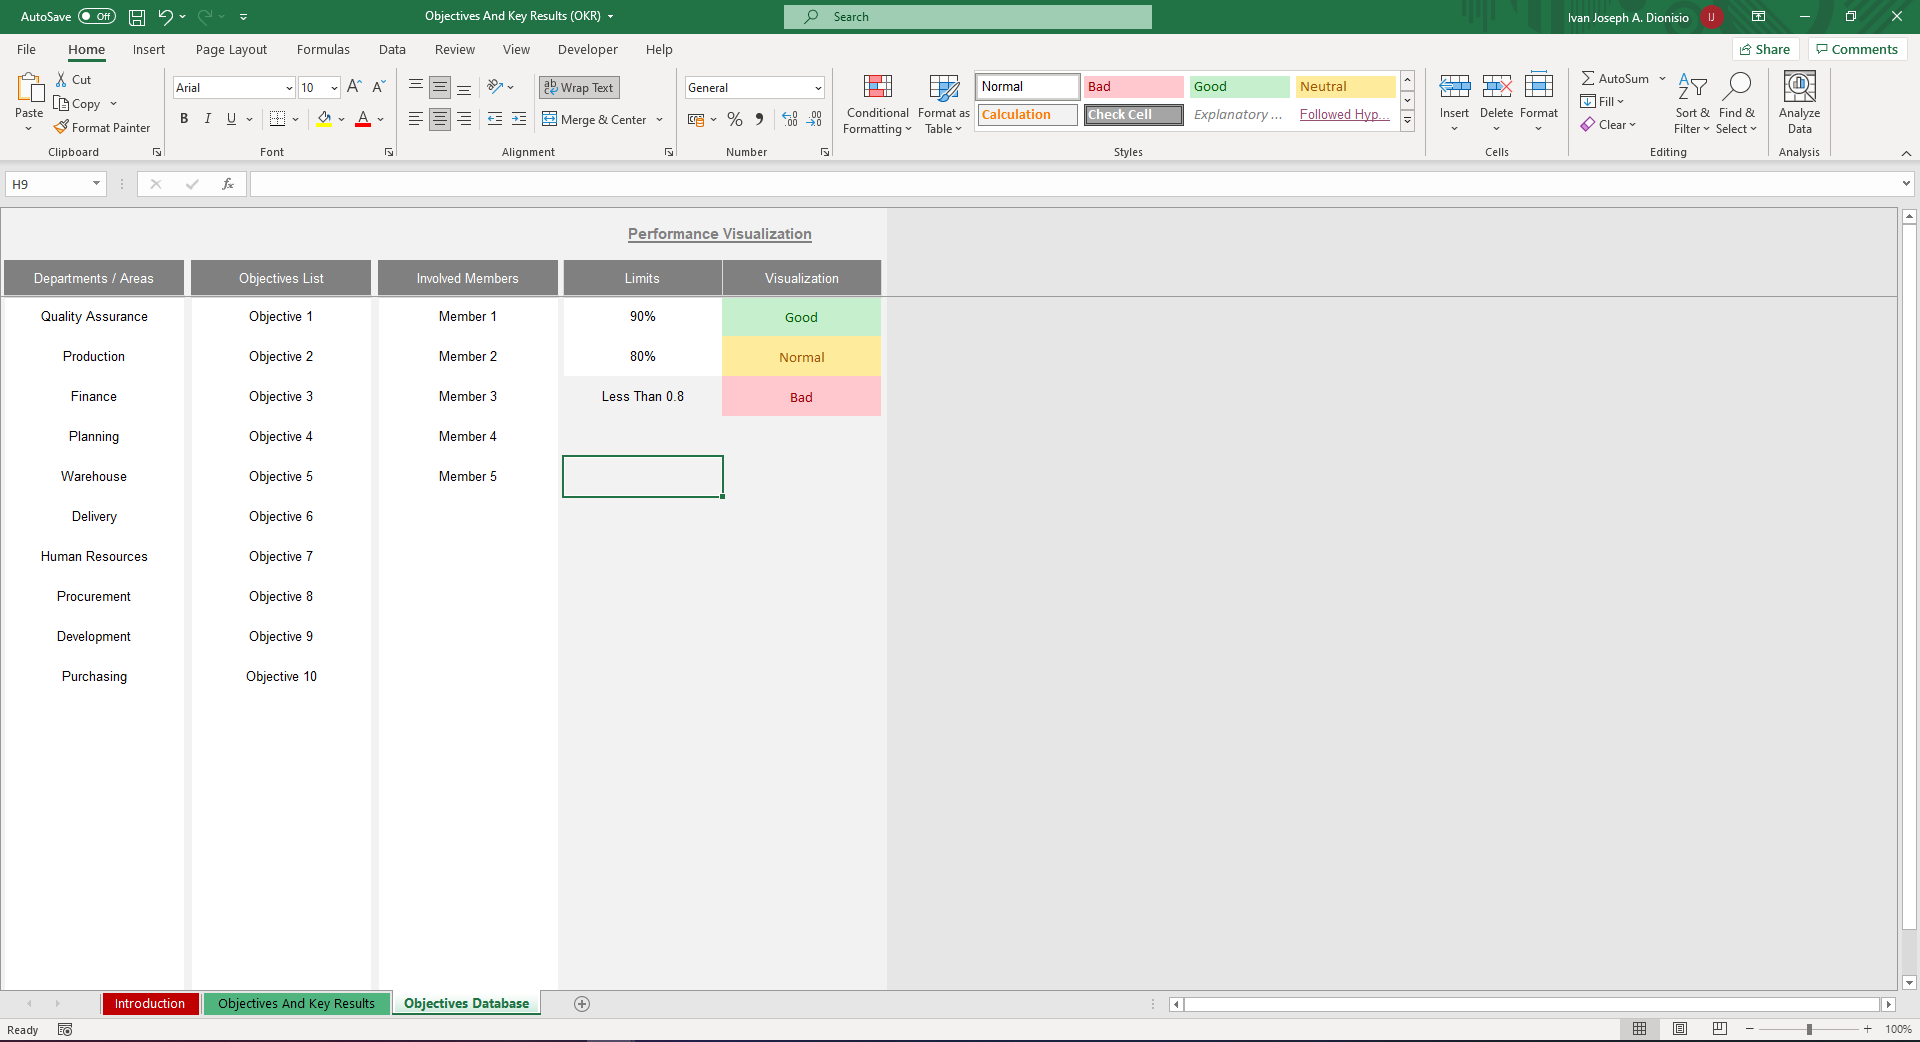
Start working on this template by going into the Objectives Database sheet. Input the different departments and areas, your List of Objectives, the Members Involved, and the parameters for your data visualizations.
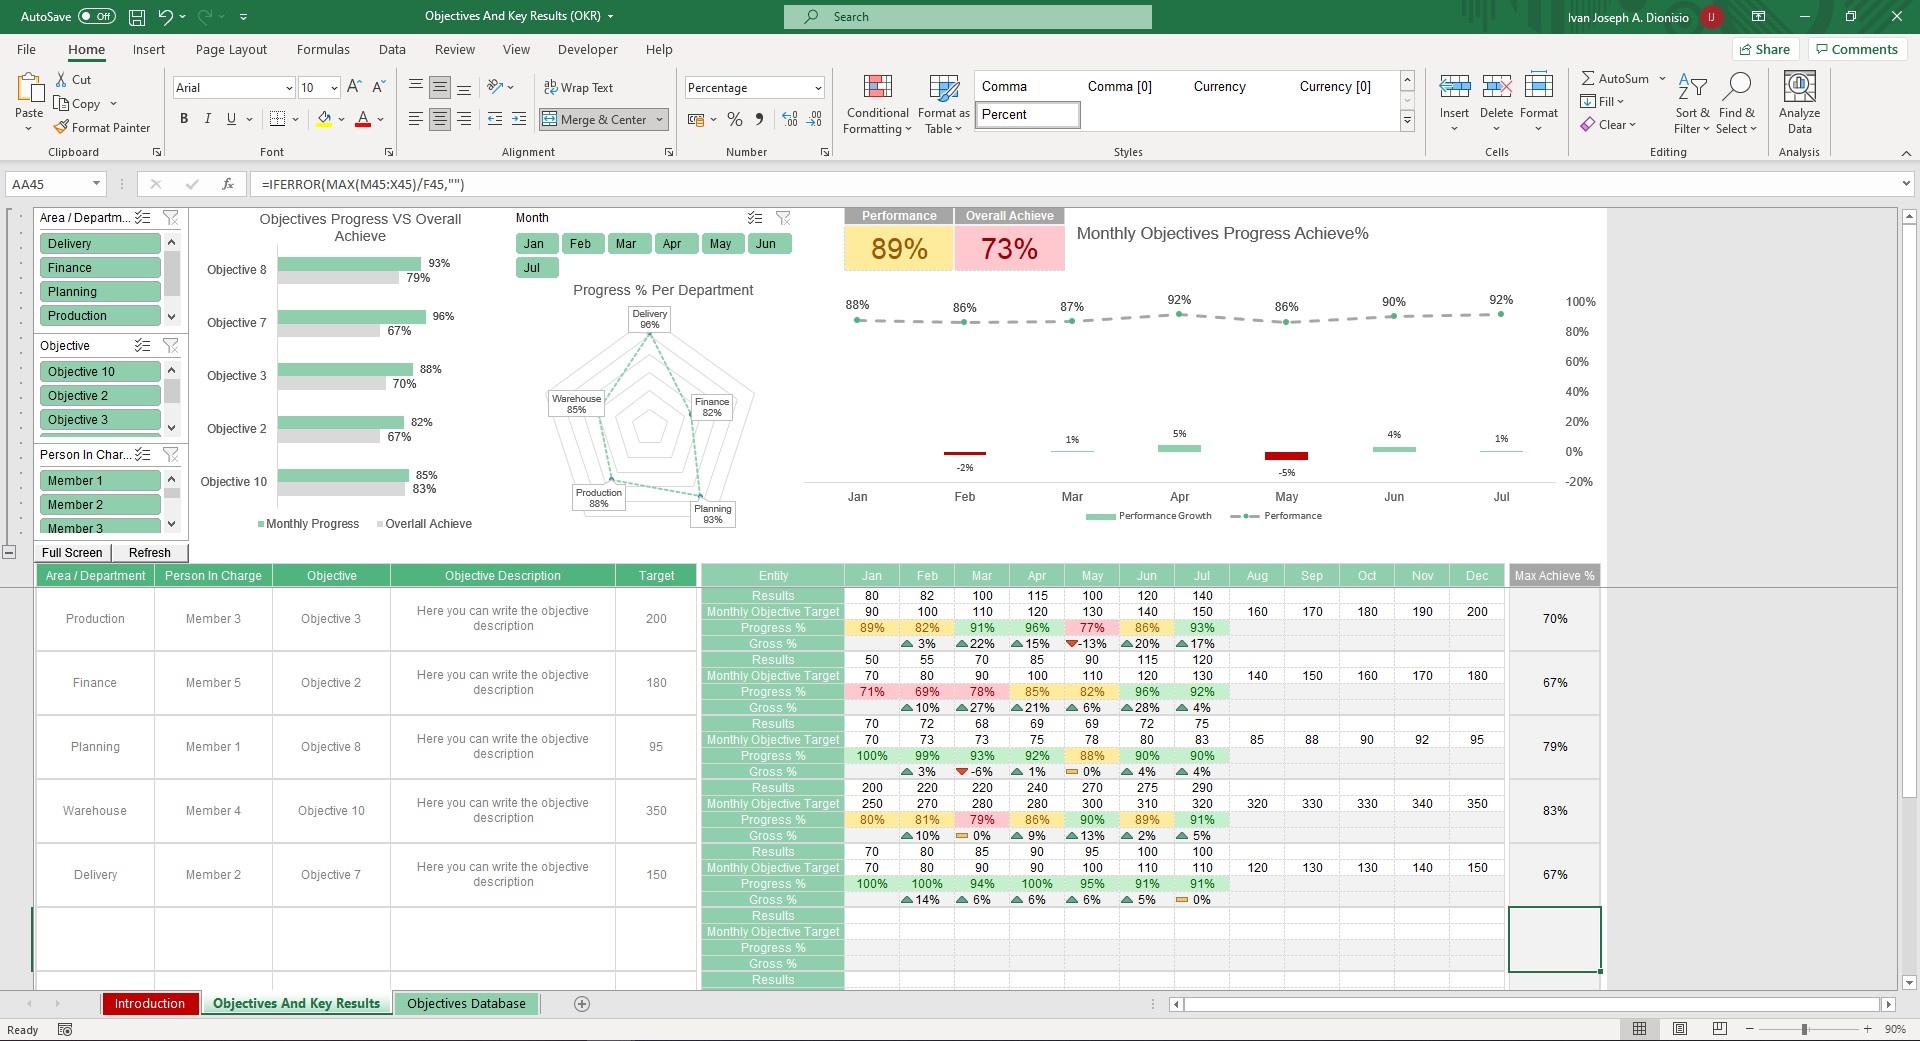
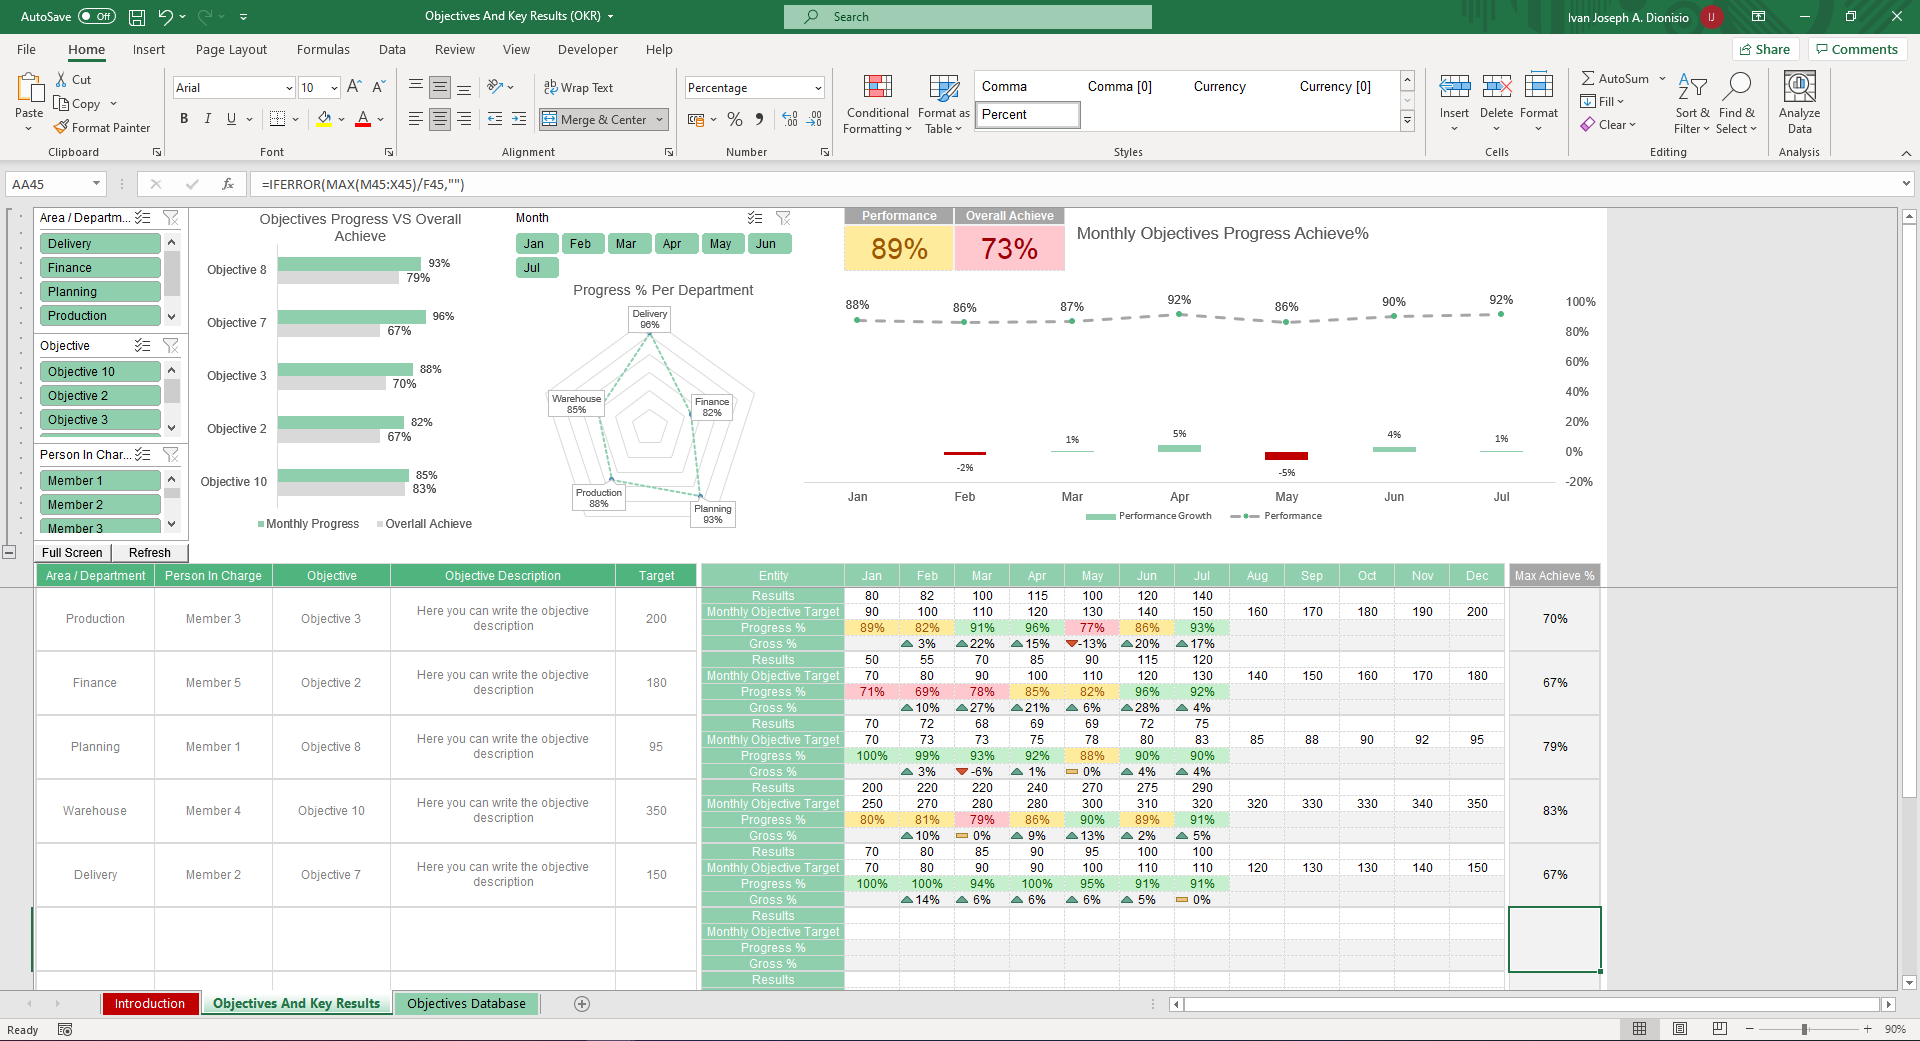
After that, you can move on to the Objectives and Key Results Sheet. Using the dropdowns, input your Area/Department, Person in Charge, Objective, and the Objective Description. Manually input the Target, as well as the results, and the Monthly Objective Targets per month per objective. It automatically gives you your progress percentage per month as well as your gross progress percentage per month.
You can see your max achieved percentage at the end per objective and analyzing the data is made even easier through the included charts, such as the Objectives vs. the Overall Achieved, the Progress Percentage Per Department, and the Monthly Objectives Progress Achieved. Take control of these data points using the included interactive slicers. Staying on track to reach your goals has never been this easy!


