Marketing
Budget Analysis
Excel Template
What's Inside the Marketing Budget Analysis Template?
Details | 4 Sheets
Supported Versions | Excel 2013, 2016, 2019, Office 365 (Mac)
Category | Marketing
Tags | Spending, Budgeting, ROI, Advertising
Why Professionals Choose Simple Sheets
It's simple. Access to the largest library of premium Excel Templates, plus world-class training.

100+ Professional Excel Templates
Optimized for use with Excel. Solve Excel problems in minutes, not hours.

World-Class Excel University
With our university, you'll learn how we make templates & how to make your own.

How-To Videos
Each template comes with a guide to use it along with how-to videos that show how it works.
Inside Our Marketing Budget Analysis
Excel Template

Other than technology itself, has any business function changed as much as marketing over the last 20 years? Consumers have more choices than ever when it comes to their attention. And as attention goes, marketing follows.
With so many different channels to reach your audience, aggregating your marketing efforts can be overwhelming without a clear structure. That’s where our Marketing Budget Analysis Excel Template comes in handy.
This spreadsheet is designed to help you understand, track and optimize your marketing ad performance across channels. With the help of a dashboard, you can visualize the impact of your marketing efforts and analyze them through charts, graphs, slicers and pie charts.
Let’s dive into how to utilize our Marketing Budget Analysis Excel Template.
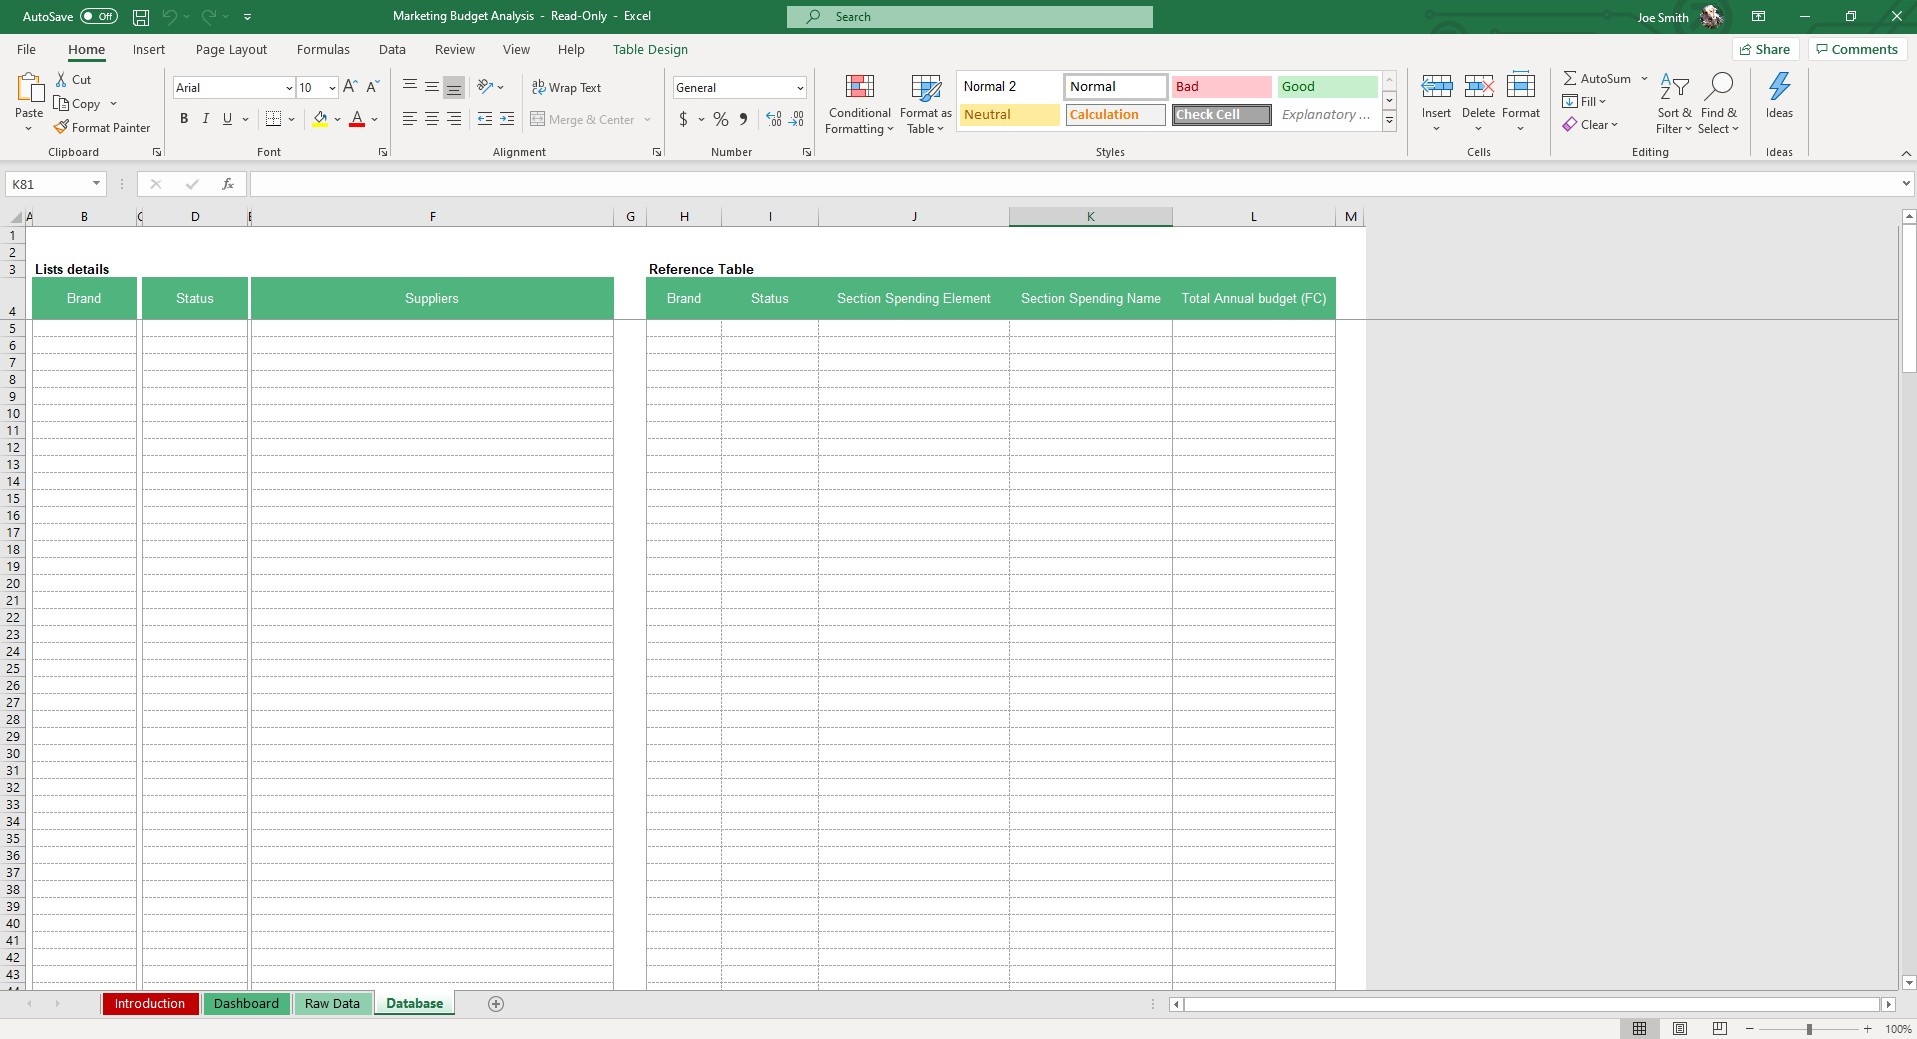
Starting in the Database sheet, record Brand, Status, Suppliers, Section Element Spending, Section Spending Name and Total Annual Budget under the List Table and Reference Table headers. Those inputs will be used in drop-downs later on to make filling out other parts of the template easier.
For internet marketers, you can add marketing channels like Facebook Ads, Snap Ads, Google Ads and more as Suppliers. A multi-pronged media approach will also include influencer campaigns and traditional marketing like TV, radio and flyers.


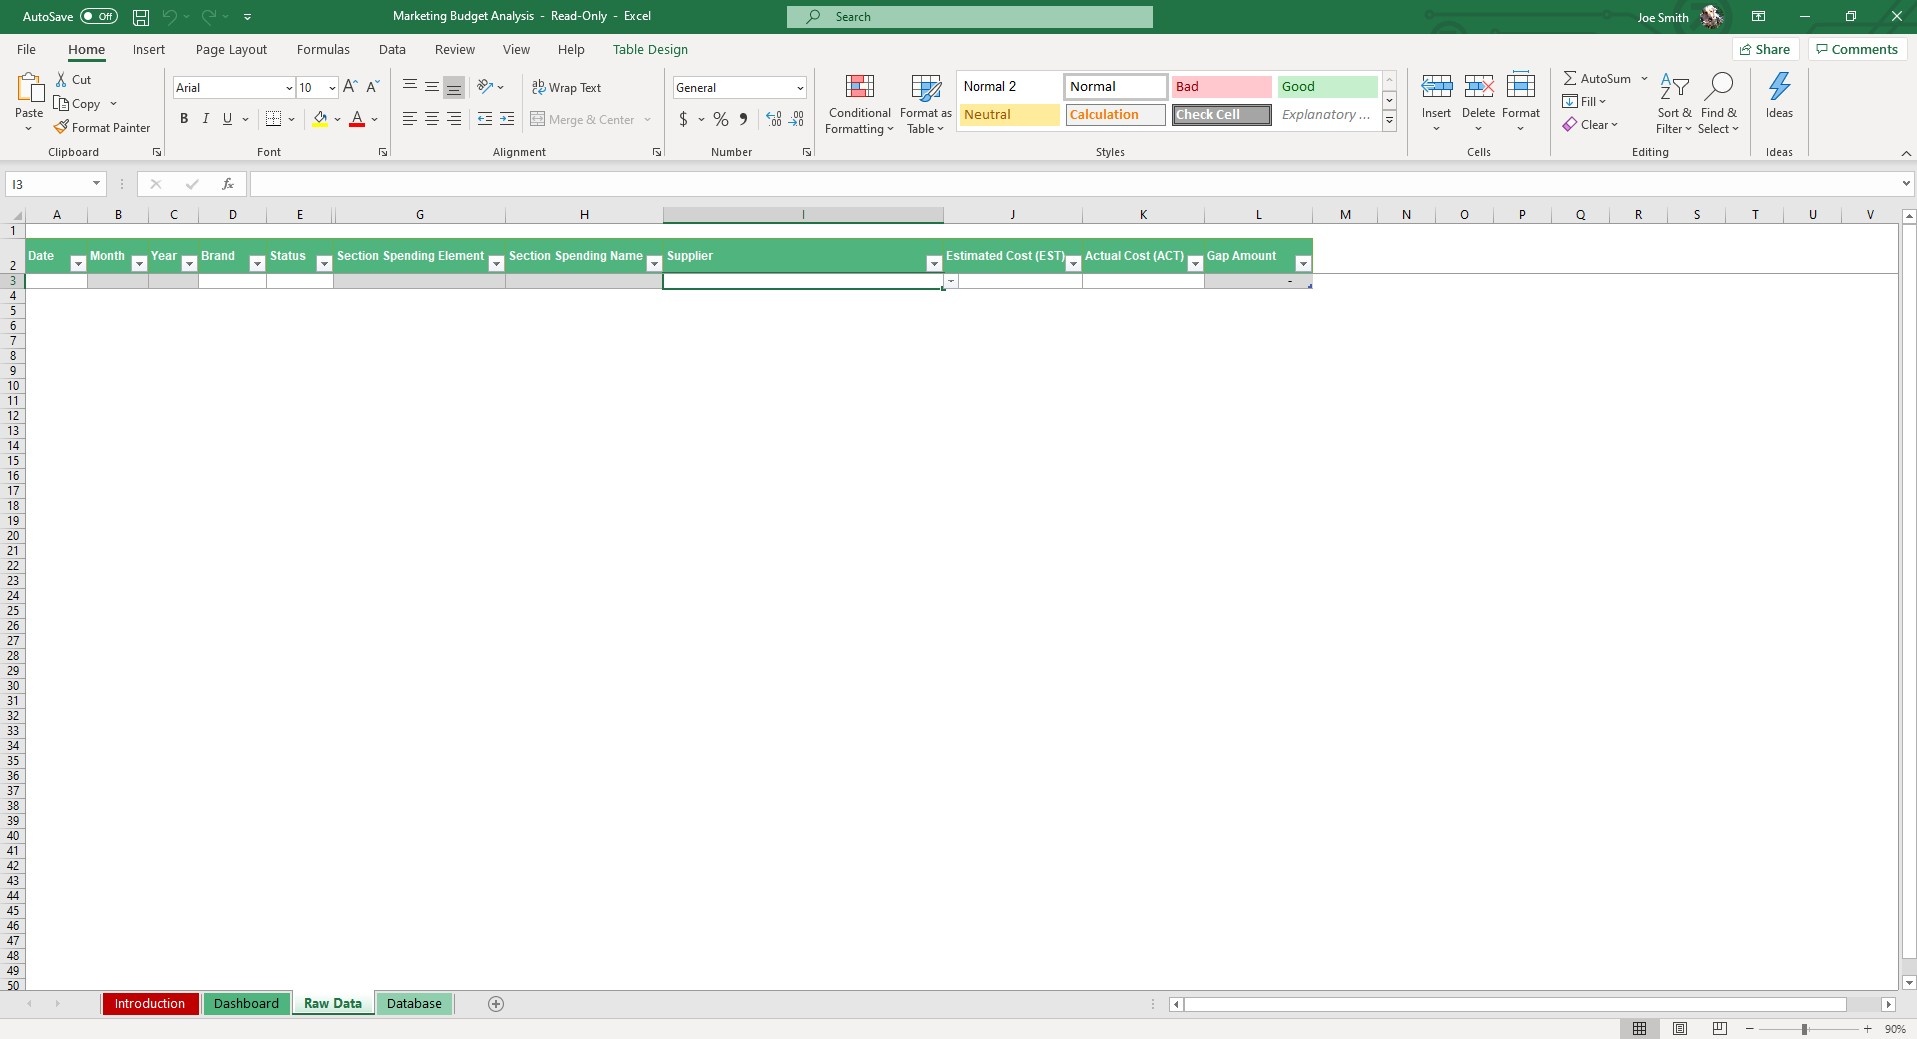
Move to the Raw Data sheet and input individual marketing campaigns. If you do not have a set Estimated Cost, it’s not mandatory as many businesses will spend as much as they can as long as they are seeing an ROI on ad spend.
Hop over to the Dashboard and click Refresh Data. Dynamic visualizations will display Monthly Win and Loss Analysis, Supplier Spending Costs, Spending Costs Per Brand, Annual Budget Per Brand, Estimated Vs. Actual and more.
Dynamic slicers on the left-hand side allow you to deep-dive into data for a specific time period (in quarters), Brand, Status and Supplier.
This template can be used by internal marketing teams, agencies and freelancers to better optimize and report ad spend.


