Year-Wise Analysis
Excel and Google Sheets Template
What's Inside the Year-Wise Template?
Details | 2 Sheets
Supported Versions | Excel 2010, 2013, 2016, 2019, Office 365 (Mac), Google Sheets
Category | Strategy & Management
Tags | YoY, Analytics, MoM,
Why Professionals Choose Simple Sheets
It's simple. Access to the largest library of premium Excel Templates, plus world-class training.

100+ Professional Excel Templates
Optimized for use with Excel. Solve Excel problems in minutes, not hours.

World-Class Excel University
With our university, you'll learn how we make templates & how to make your own.

How-To Videos
Each template comes with a guide to use it along with how-to videos that show how it works.
Inside Our Year-Wise
Excel and Google Sheets Template

The heaviest hitting infomercials are the before and after weight loss photos. They make you believe and see the growth (or shrinkage) from time period A to time period B.
Those commercials show us how 1) cheesy they are and I’m so glad I rarely see them and 2) how comparing points over a certain period of time is a powerful and useful context.
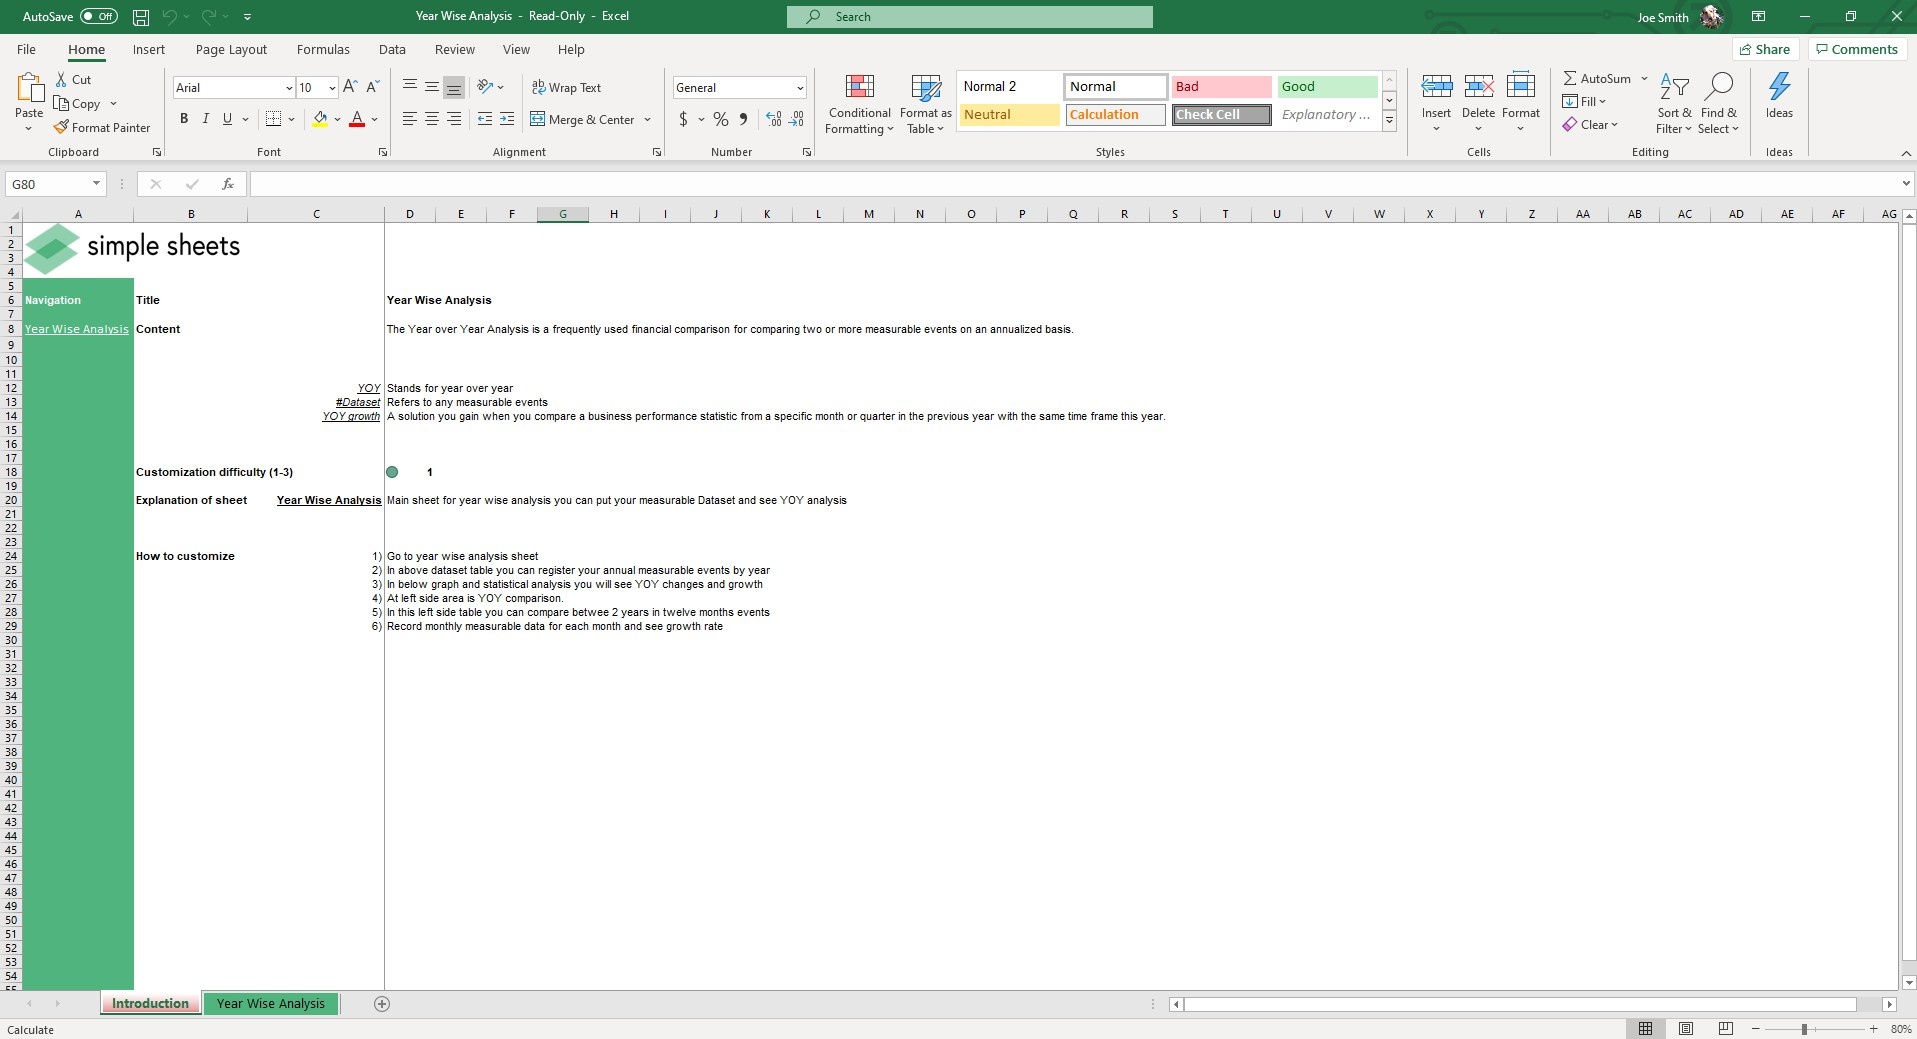
Our Year Wise Analysis Excel Template is a handy financial tool for comparing two or more measurable events on an annual basis.
Even if you are not an Excel wizard, this is a very accessible template to help you evaluate your data.
Before we dive into how this template works, if you like comparing data you will also love our Pareto Diagram or Variance Analysis templates. They make it easy to identify where power laws exist and variances in data.
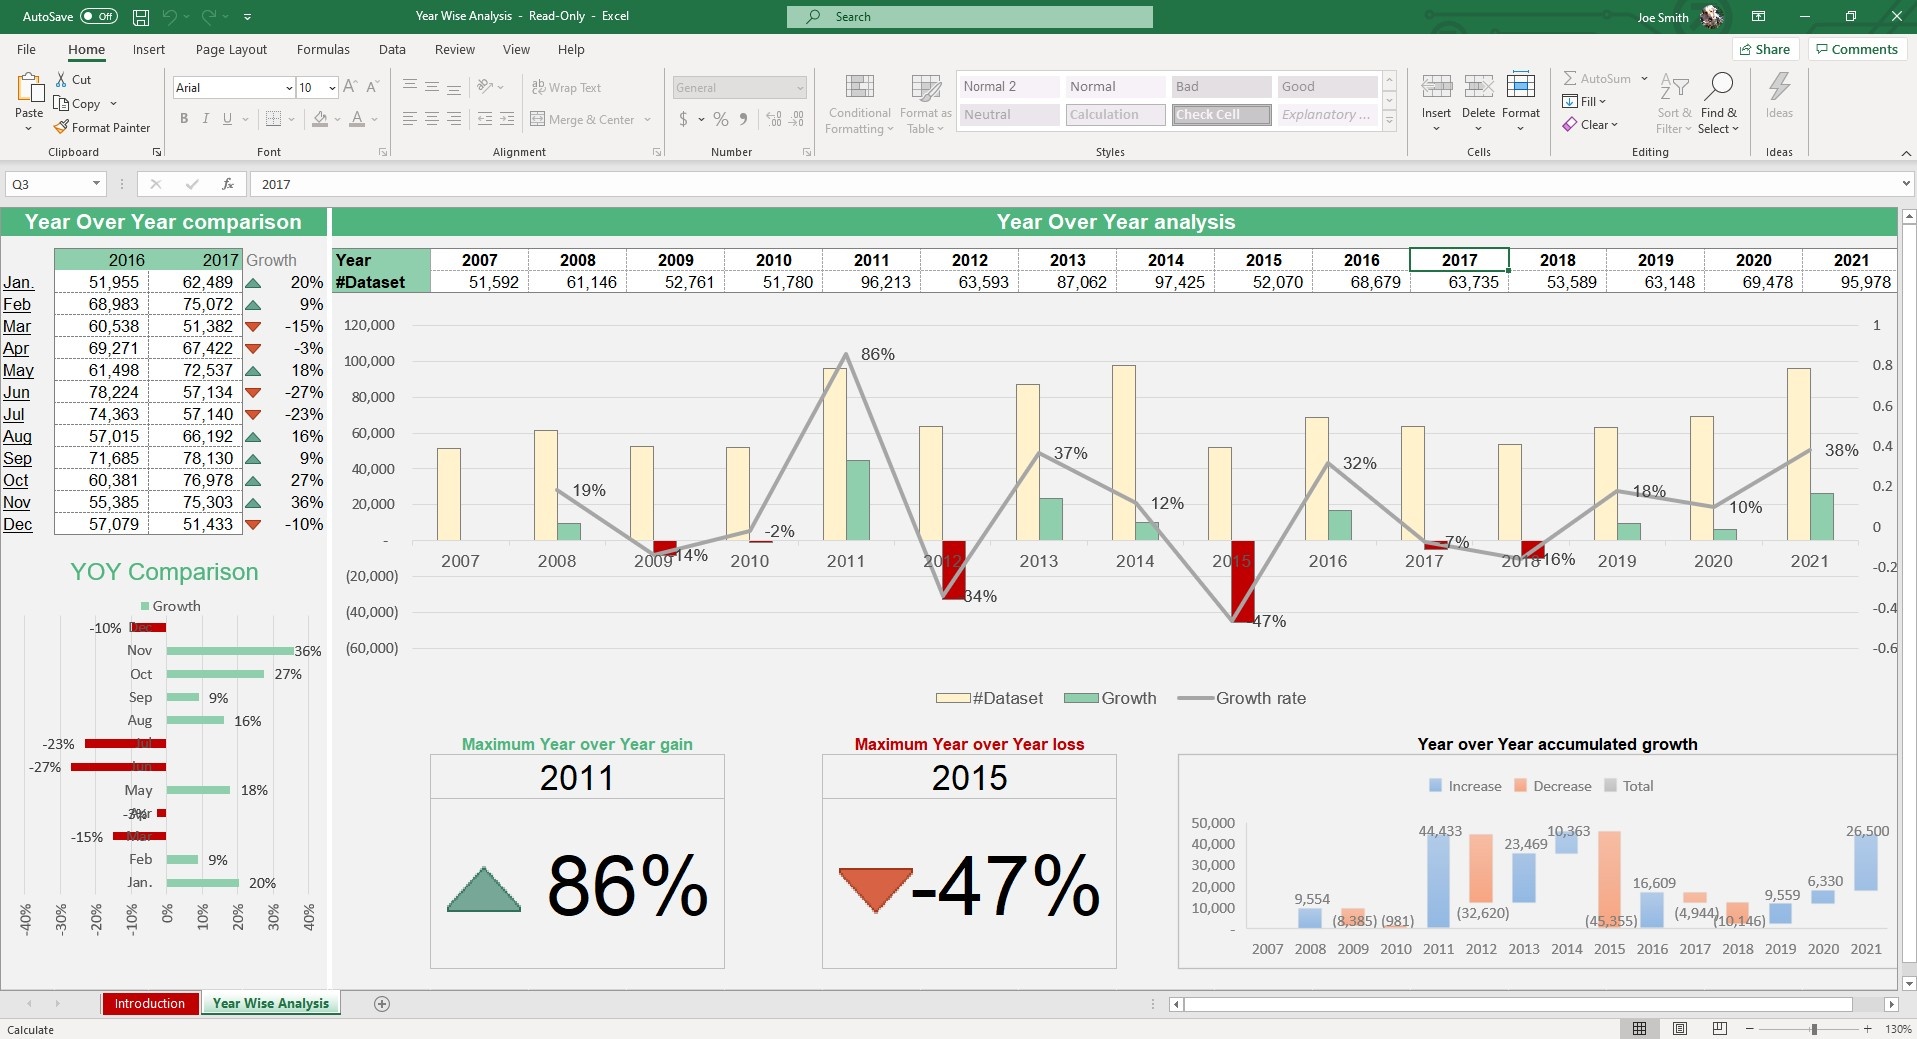
In the section titled Year of Year Analysis, input your annual measurable events by year. Your chart will automatically plot your Dataset, Growth and Growth Rate. Key stats will also generate below, like your Maximum Year over Year Gain, Maximum Year over Year Loss and Year over Year Accumulated Growth.
On the left side of the sheet is a section with the header Year over Year Comparison. In the table you can compare between two years in twelve month events. Simply, record measurable data for each month and the growth rate will magically appear.

This template serves broad use-case scenarios whether it be revenue, cost, fantasy football scoring, income, attendance, users and just about anything else that is measurable and over a period of time.
Visualizing that data in real-time with graphs and charts puts your datasets into perspective. Those visuals can be especially convincing if you are comparing something for work or to make an argument.
If that wasn't enough reason to get this template, did you know this template is compatible with Google Sheets? Collaborate with your co-workers in real time and enjoy the cloud auto-save feature of Sheets when you use this template!


