Workload Analysis
Excel Template
Download 5 Dynamic Templates For Free!
Where should we send your template?
What's Inside the Workload Analysis Template?
Details | 3 Sheets
Supported Versions | Excel 2013, 2016, 2019, Office 365 (Mac), Google Sheets
Category | Supply Chain & Operations
Tags | Project Planning, Overtime Management, Work Hour Tracking

Why Professionals Choose Simple Sheets
It's simple. Access to the largest library of premium Excel Templates, plus world-class training.

100+ Professional Excel Templates
Optimized for use with Excel. Solve Excel problems in minutes, not hours.

World-Class Excel University
With our university, you'll learn how we make templates & how to make your own.

How-To Videos
Each template comes with a guide to use it along with how-to videos that show how it works.
Inside Our Workload Analysis
Excel Template
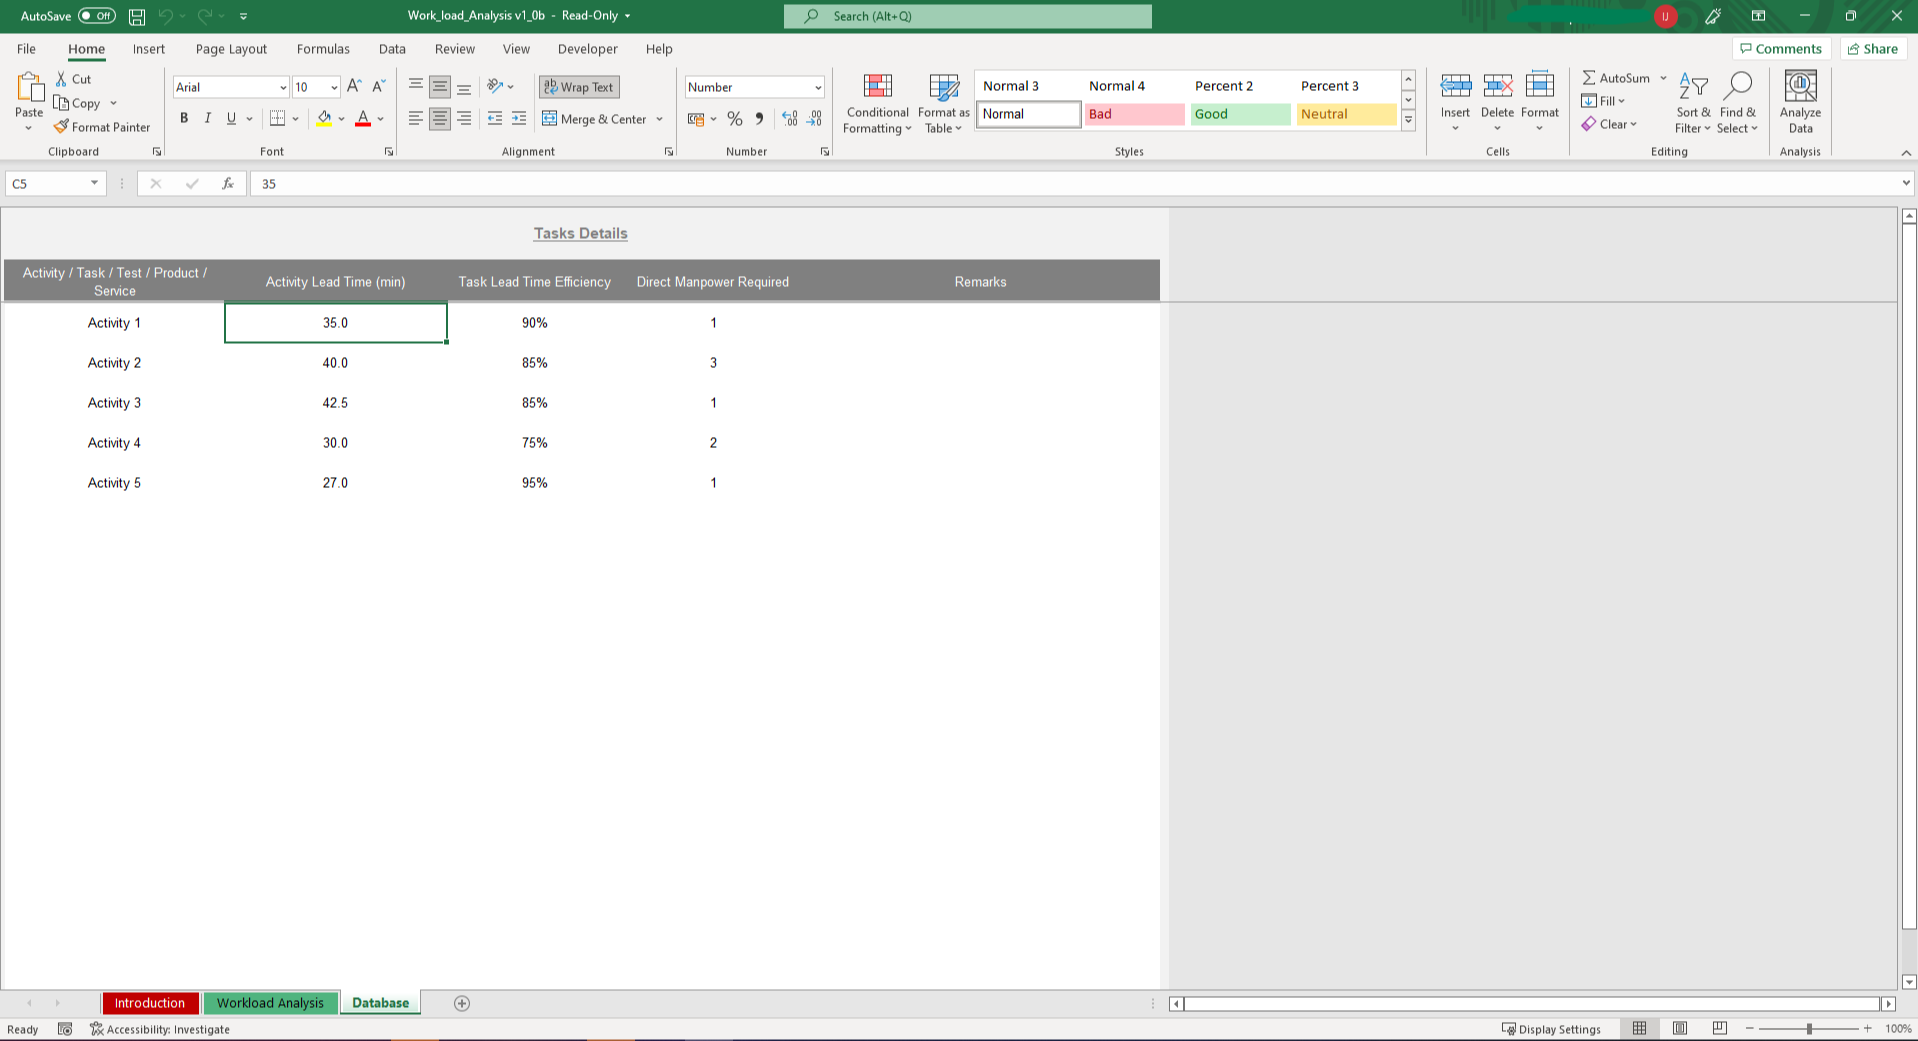
To win in the marketplace, you must first win in the workplace! We all know that all great projects and businesses need people to bring them into fruition. Without people, work is simply just not work. With our Work Load Analysis Template for Microsoft Excel, easily and instantly determine how many people you need to make your business come to life. In just a few simple steps and with even fewer data required, you can setup a work load plan in a matter of minutes instead of hours or even days! Before we dive into how to use this awesome template, be sure to check out our other operations templates such as the Warehouse Management System, Master Production Schedule, and Manufacturing KPI Management templates. All these templates would come in handy when it comes to managing stock and workloads in your production lines.
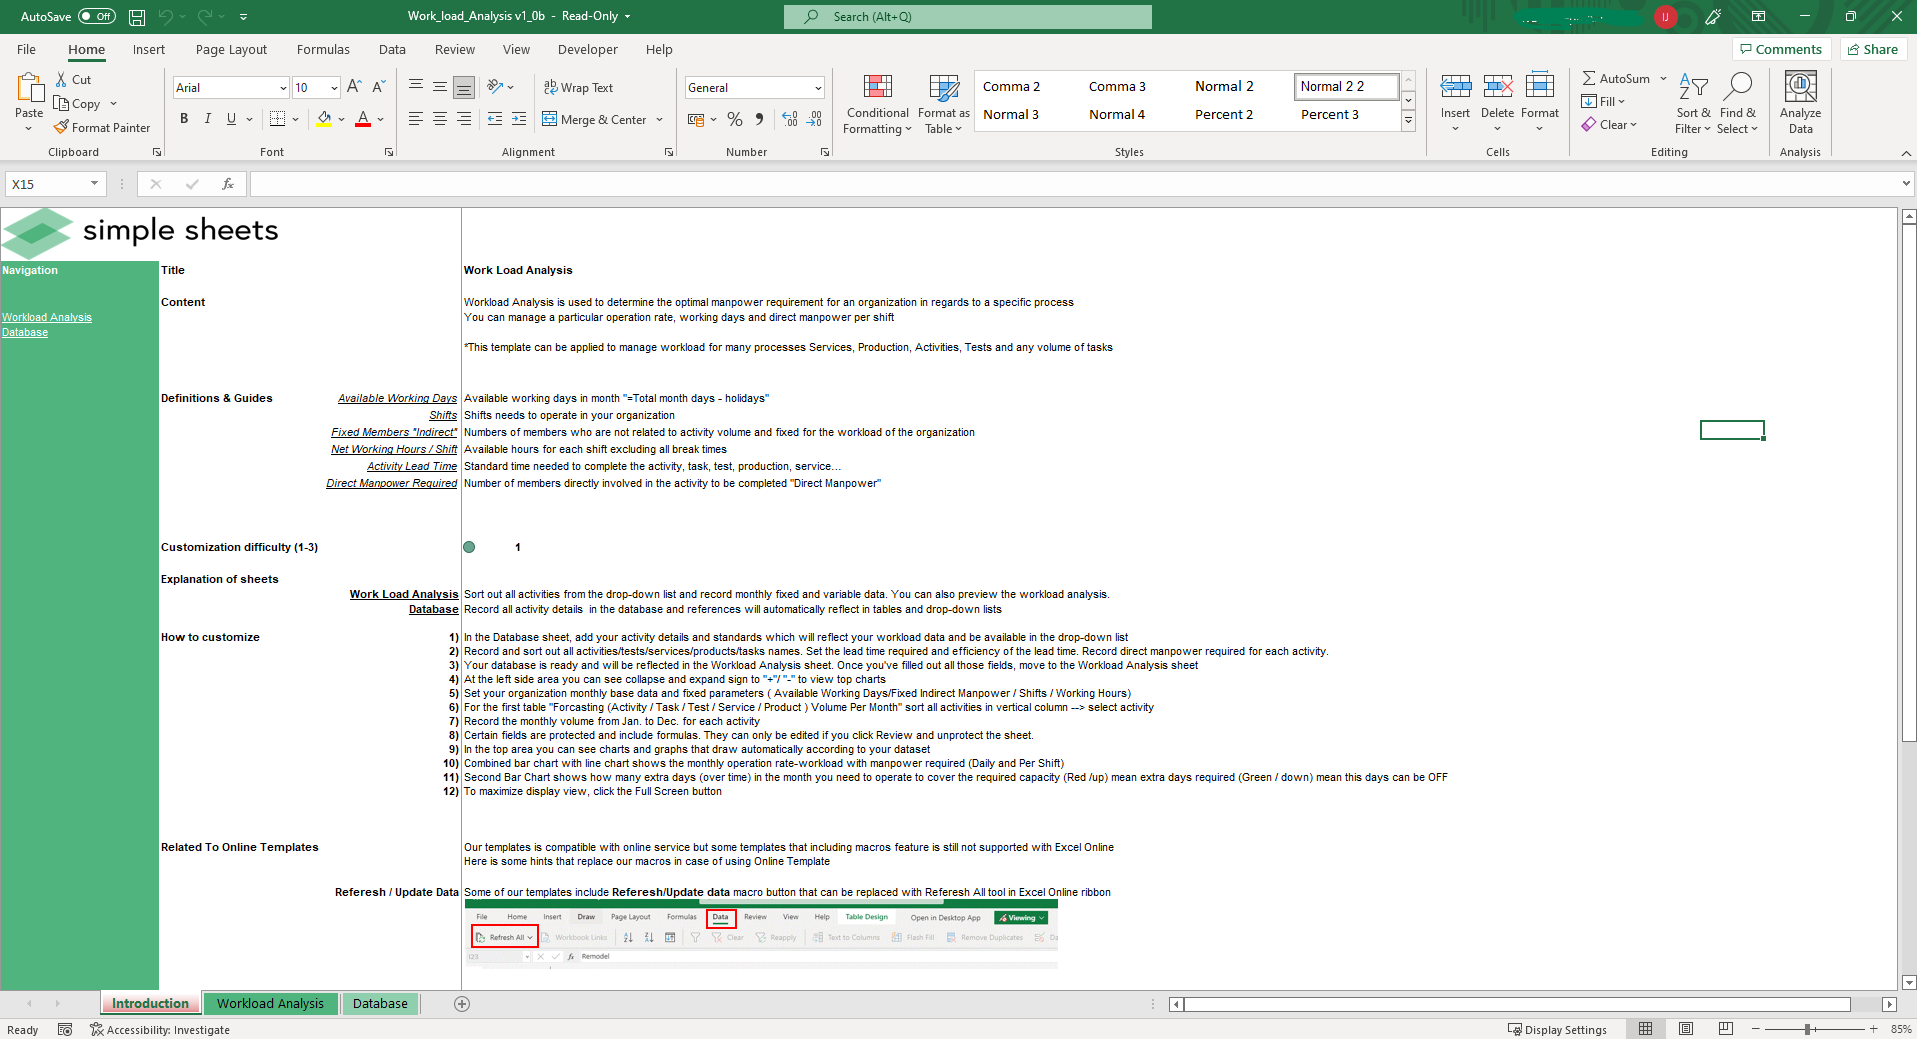
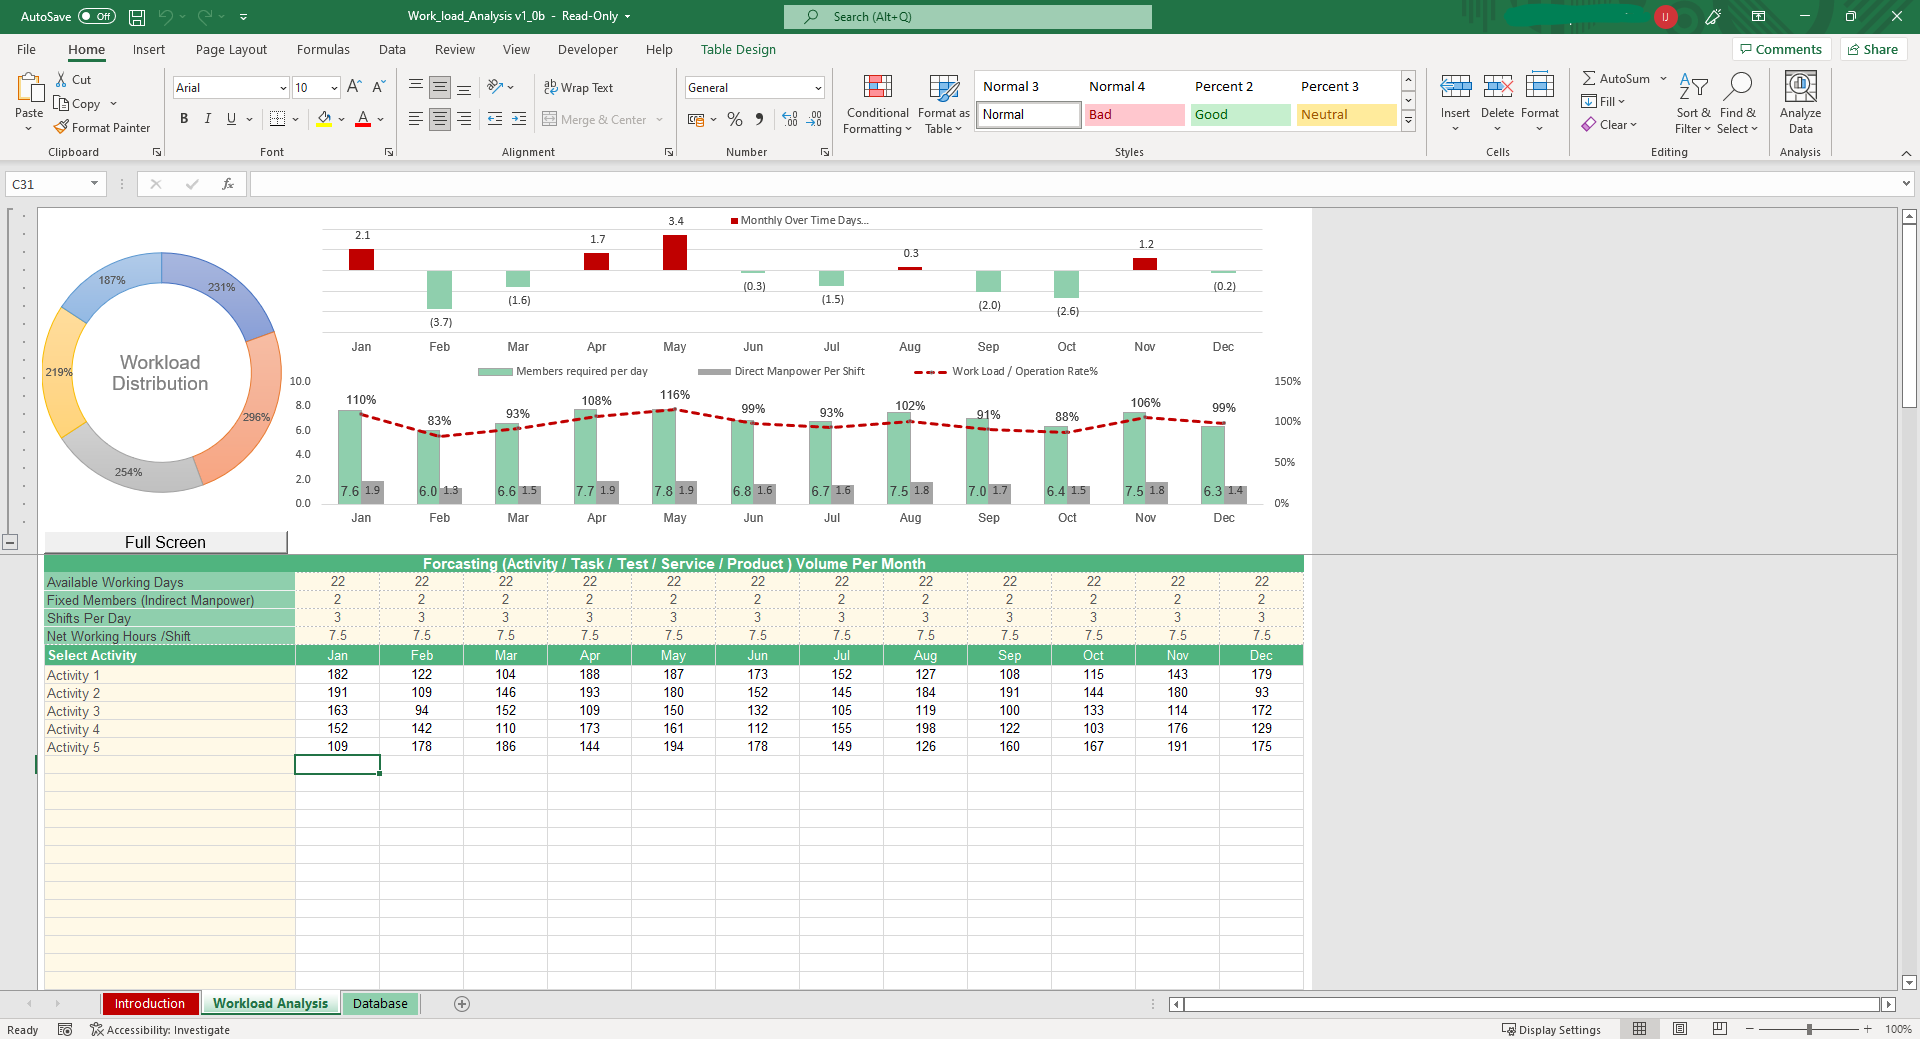
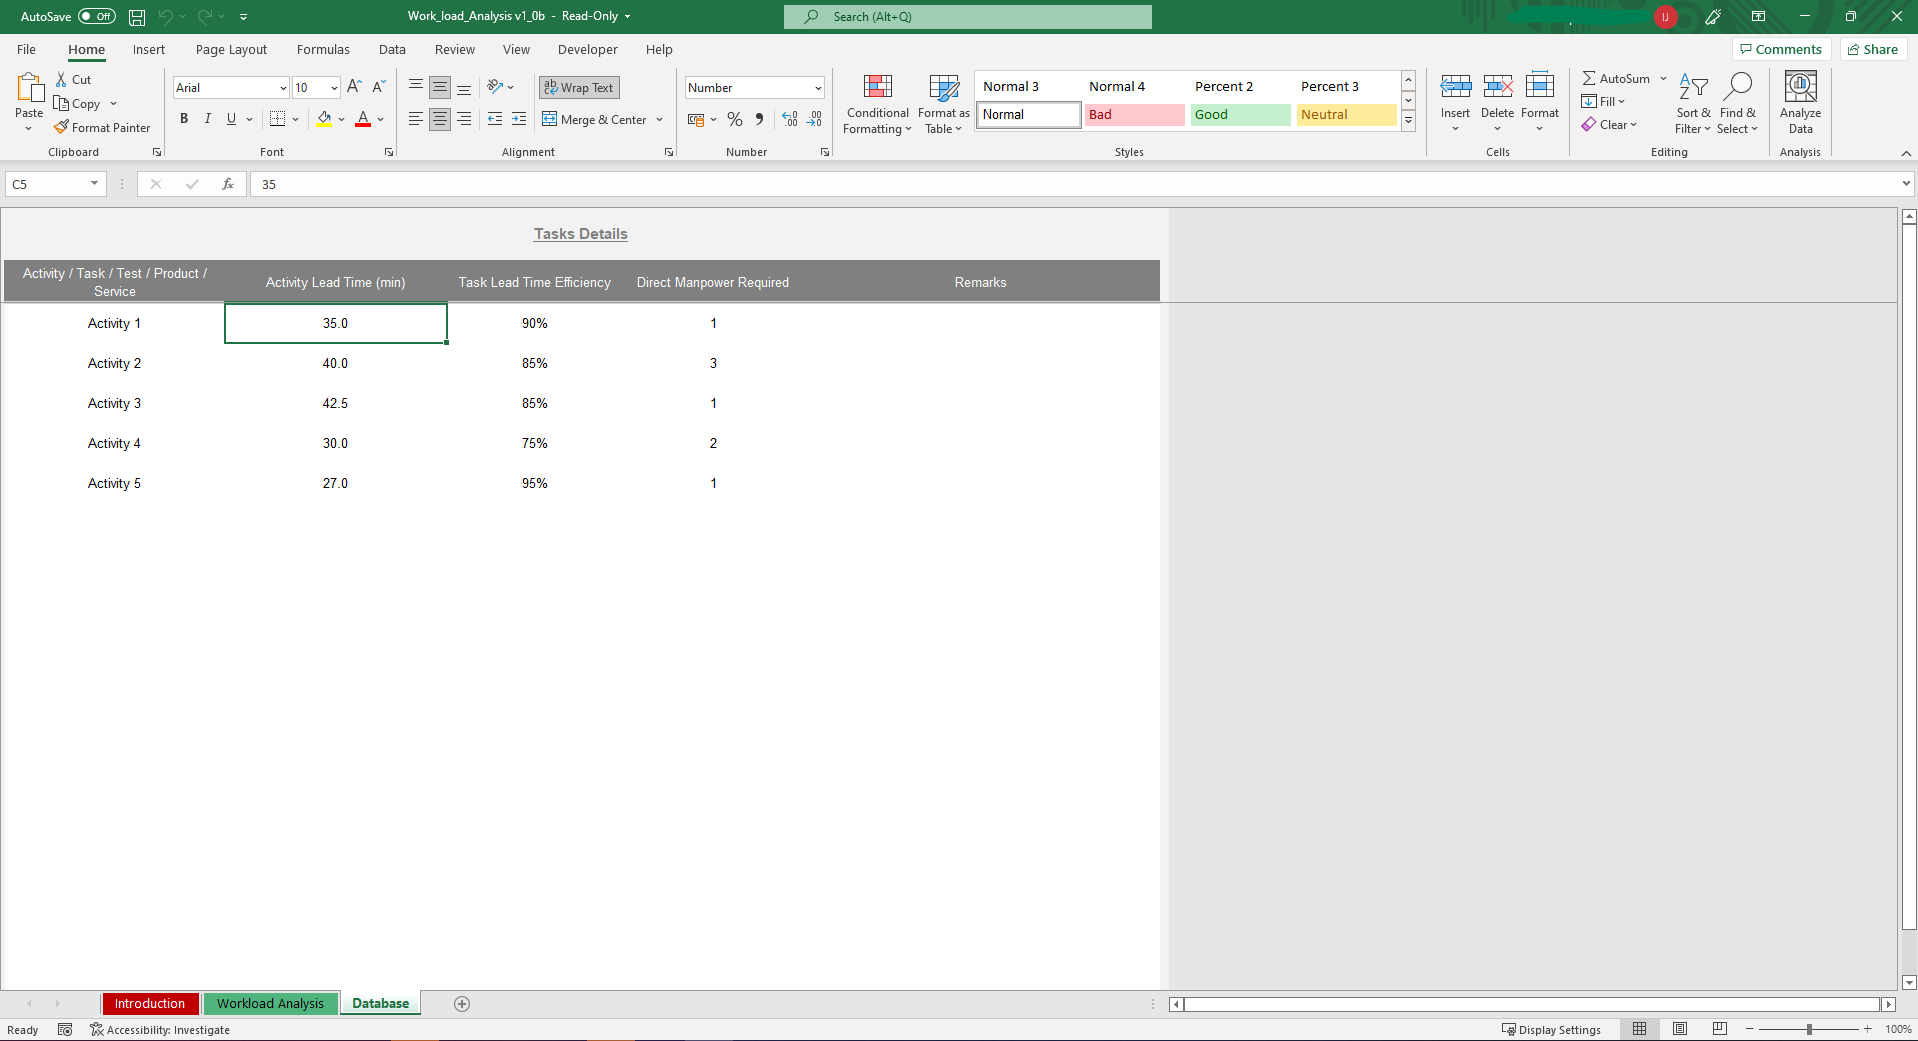
The template begins in the Data Sheet. Enter here the different activities, tasks, tests, products, or services that you’ll be analyzing. Enter their respective lead times, perceived task lead time efficiency, as well as the direct manpowered required for the task. Moving over to the Workload Analysis Sheet, there are months laid out where we’ll be entering our needed output volume later on. In the meantime, we can add the available working days, fixed members or indirect manpower, shifts per day, and net working hours per shift. After that, in the activity portion, select the activity using the drop-down list and input the corresponding required output volume for that activity for each of their corresponding months.
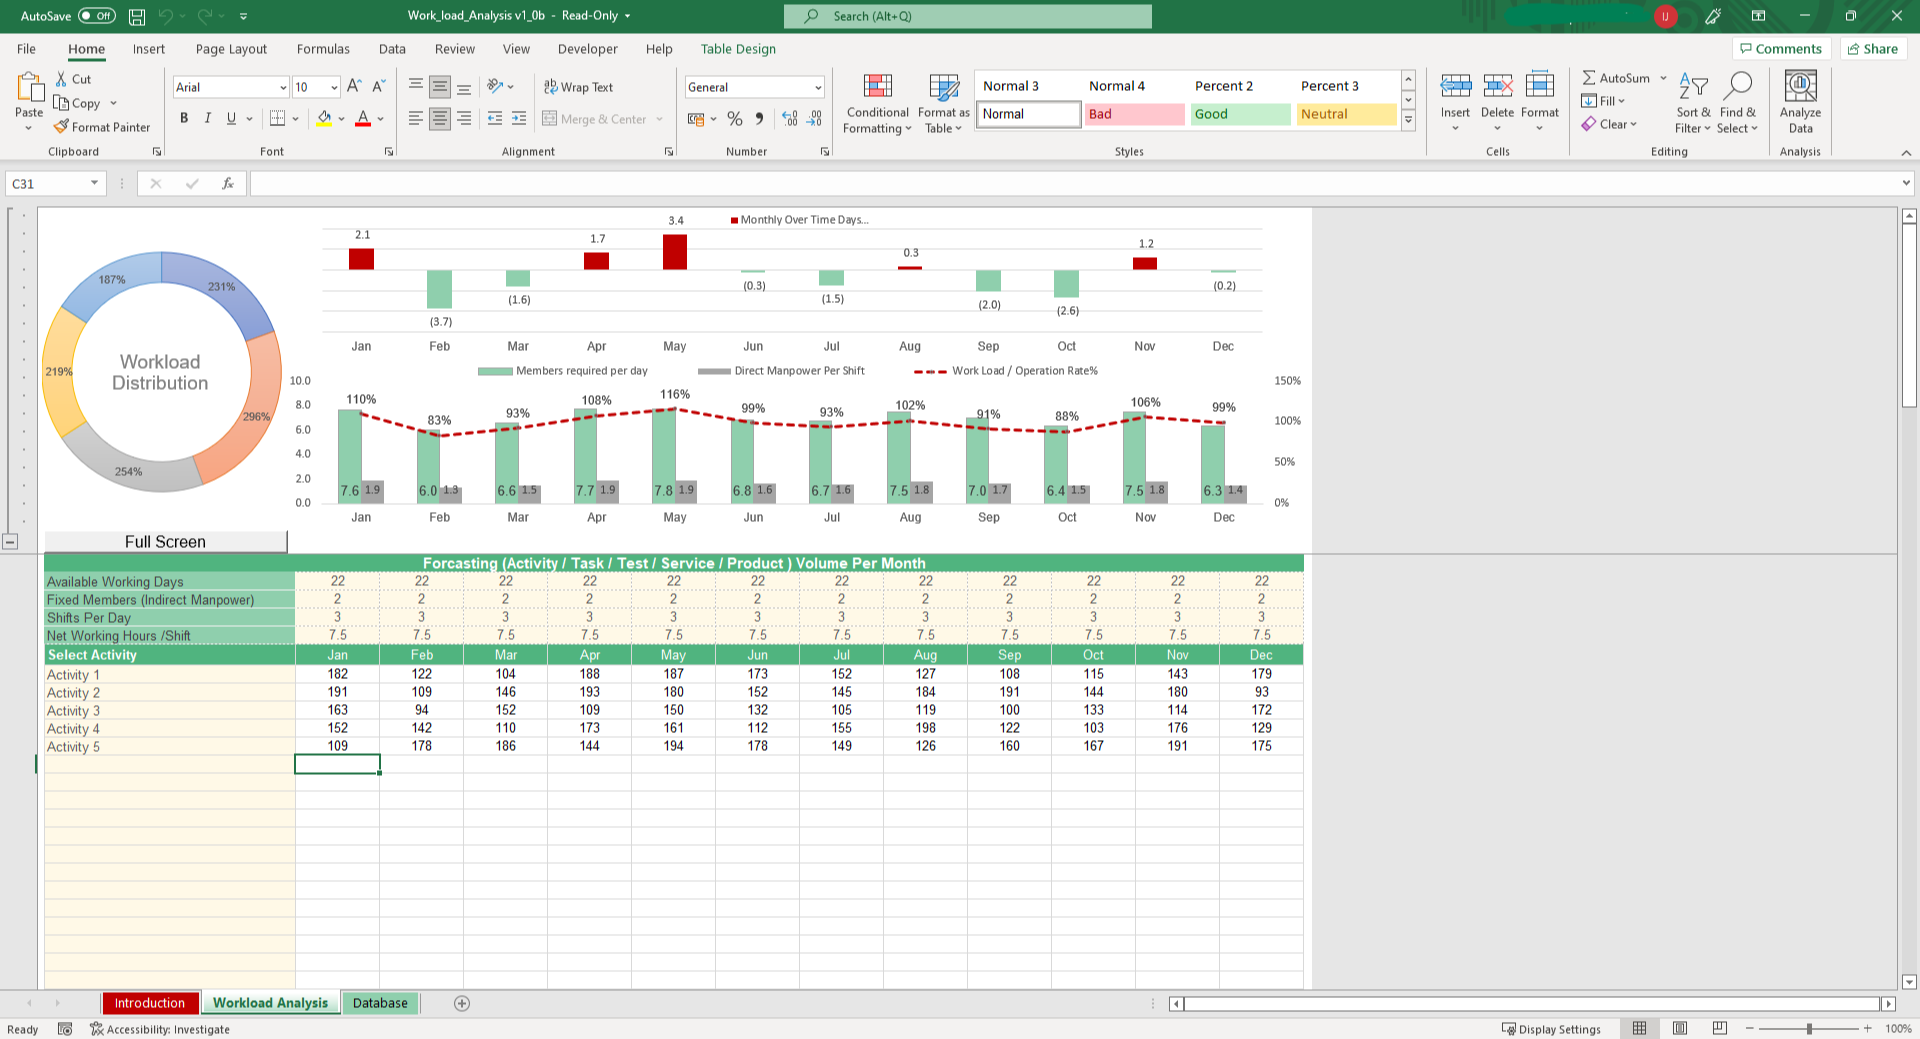
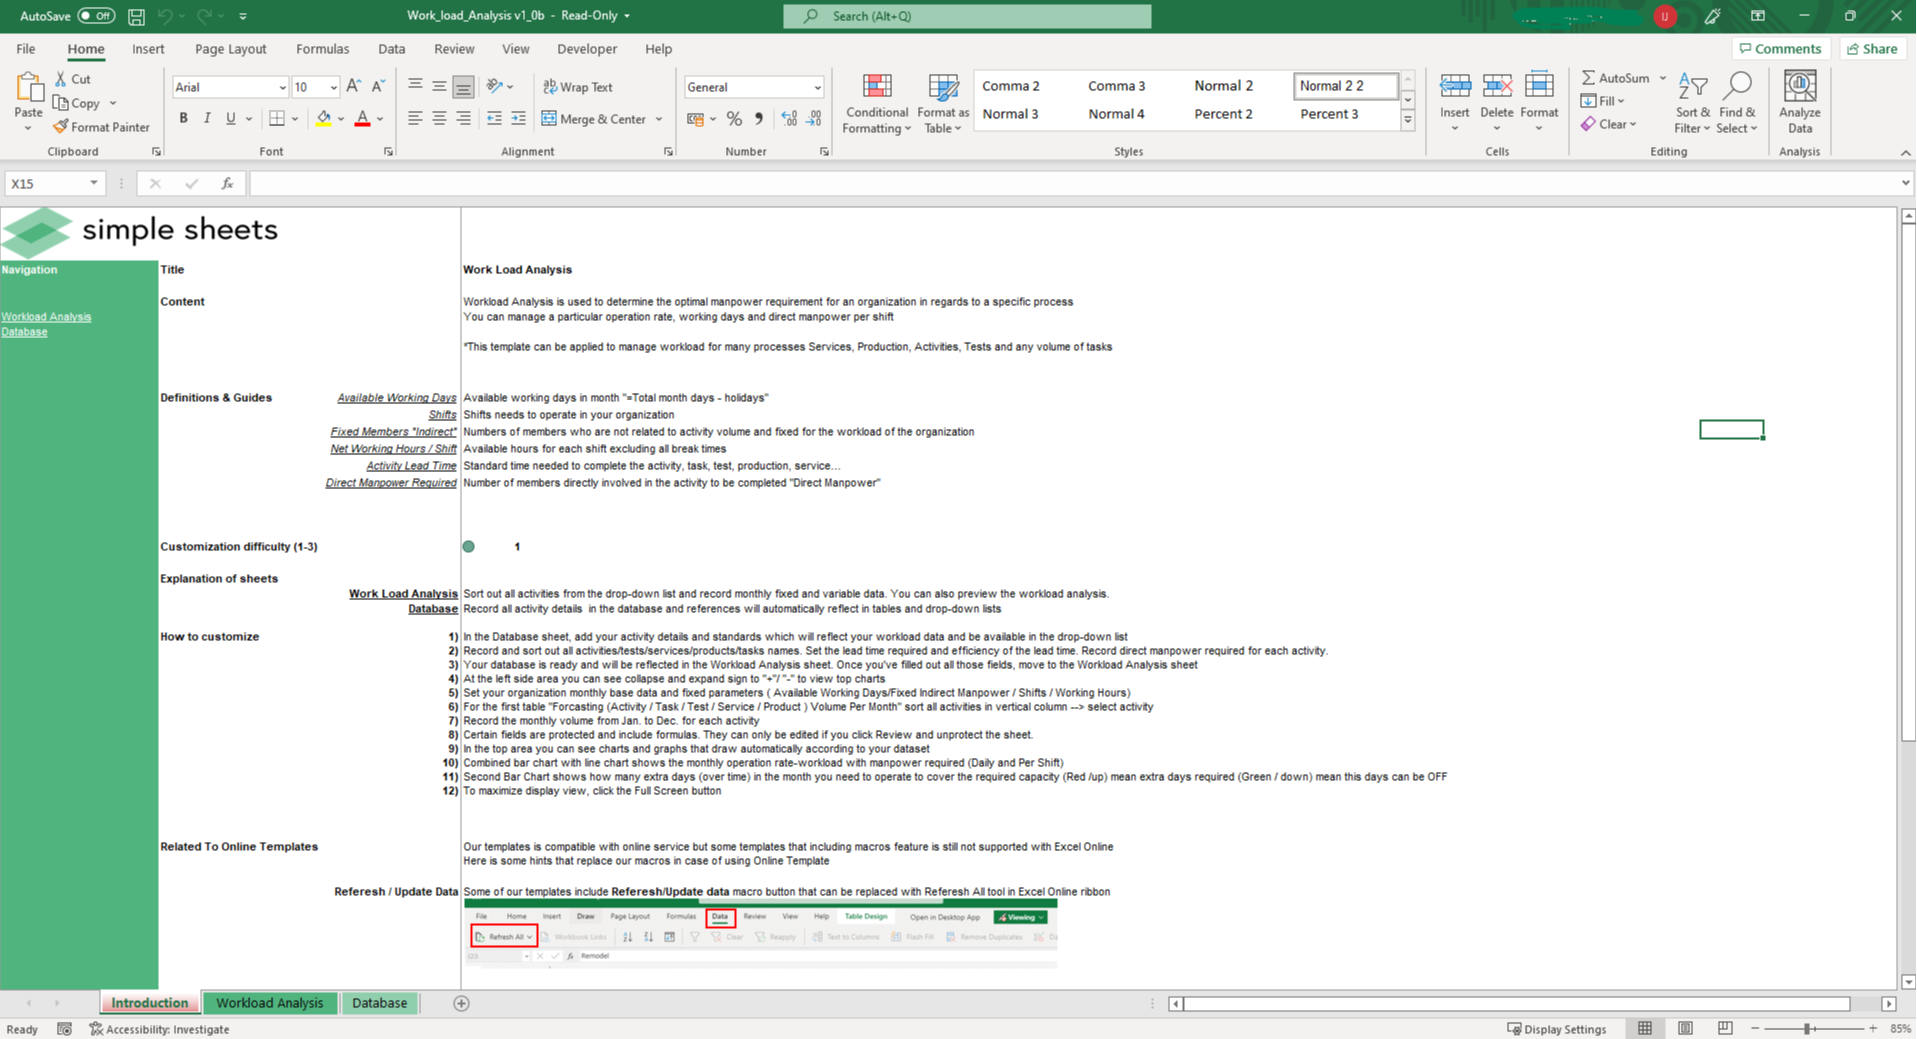
That’s basically it! If you scroll down, you’ll see some important calculations that are done for you automatically. These include the working time required, operation rate per workload, and workers required per shift. At the bottom, you’ll see the total required manpower per month, overall manpower requirement for all shifts in the month, and the over time working forecast. On the top portion you have a comprehensive dashboard that you can hide or show using the plus or minus sign on the left hand side. You get a workload distribution chart for the different tasks or activities you have, a very useful chart that shows you how many days in the months would you require overtime, and a chart that shows you’re your workload with respect to the required manpower vs the direct manpower per shift. Making the most out of what you have and who you have has never been easier than with Excel and Simple Sheets.


