Sales Forecasting
Excel Template
What's Inside the Sales Forecasting Template?
Details | 4 Sheets
Supported Versions | Excel 2010, 2013, 2016, 2019, Office 365 (Mac)
Category | Finance
Tags | Business Model, KPI, Recurring Revenue, Subscribers, Startups

Why Professionals Choose Simple Sheets
It's simple. Access to the largest library of premium Excel Templates, plus world-class training.

100+ Professional Excel Templates
Optimized for use with Excel. Solve Excel problems in minutes, not hours.

World-Class Excel University
With our university, you'll learn how we make templates & how to make your own.

How-To Videos
Each template comes with a guide to use it along with how-to videos that show how it works.
Inside Our Sales Forecast
Excel Template

Sales Forecasting is a business practice for predicting future sales. This has become a crucial technique for managers who want to be able to make informed decisions on hiring, prospecting, budgeting, overhead, inventory and other aspects of running a business.
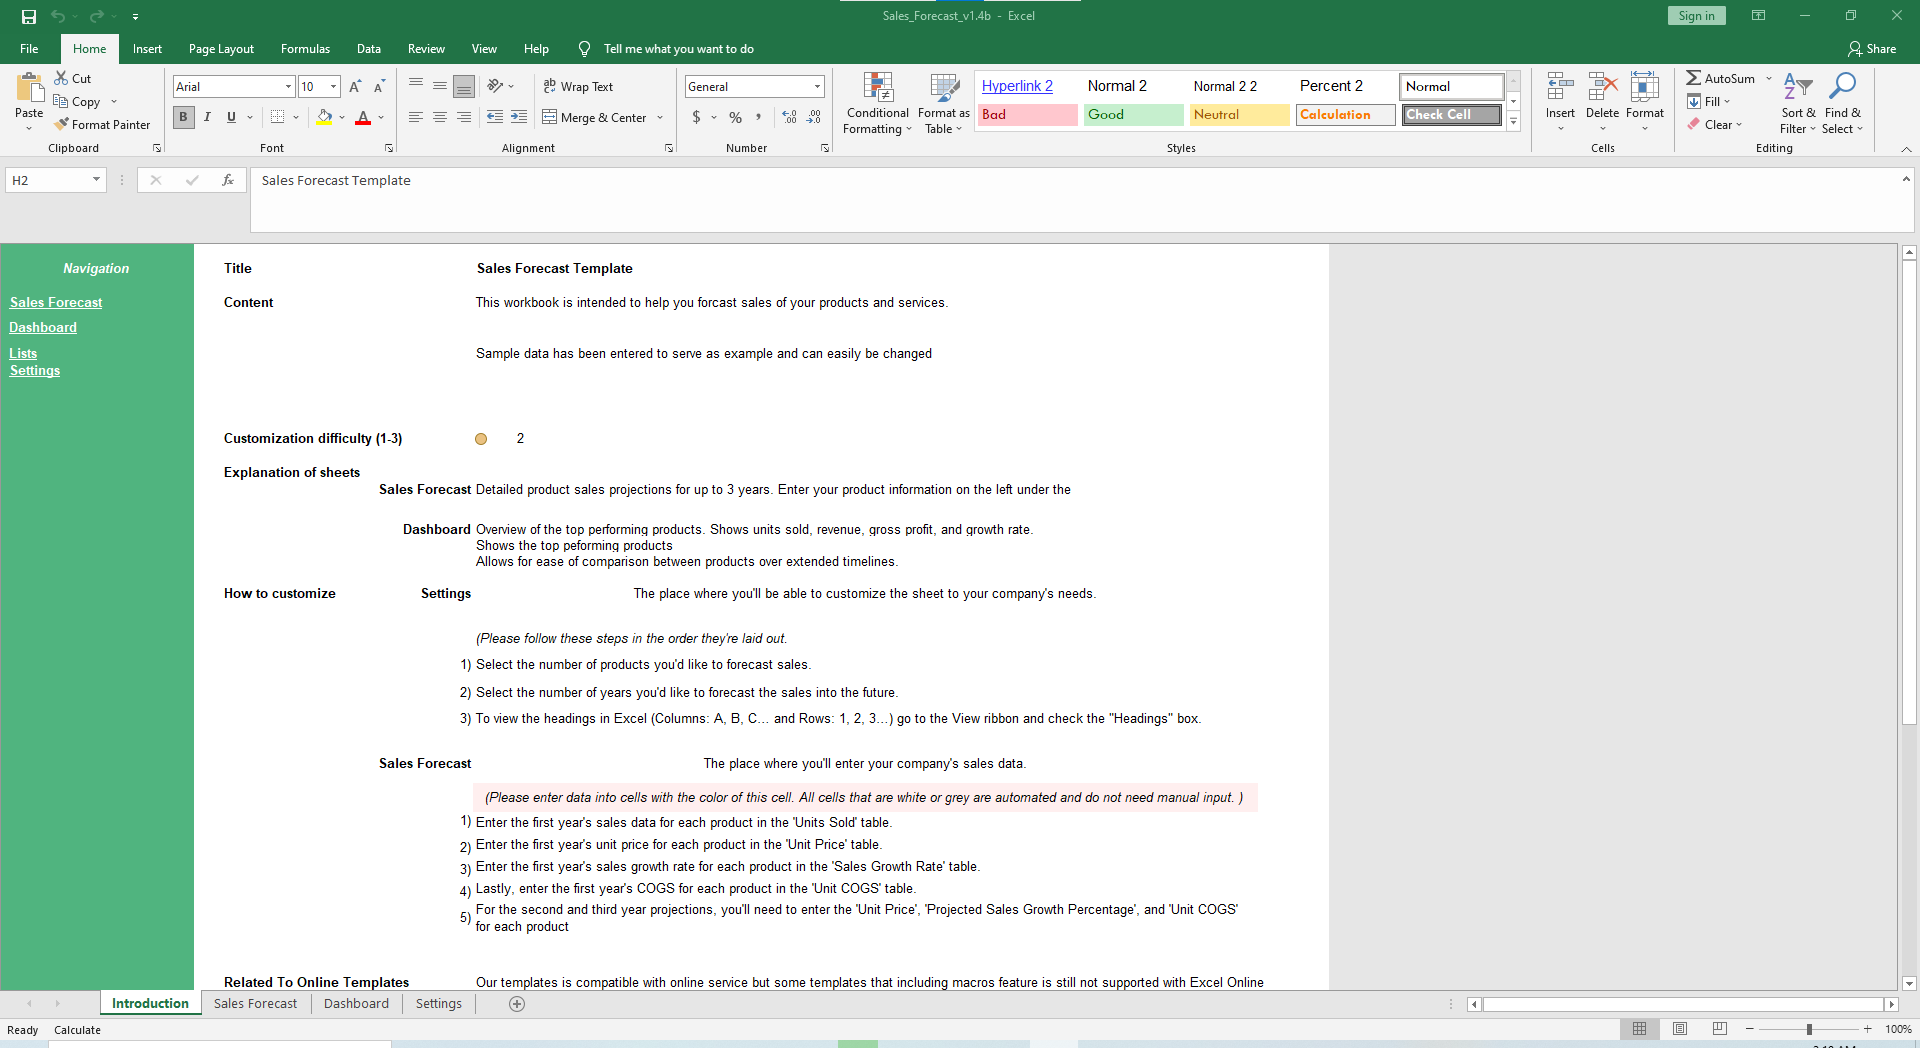
Our Sales Forecasting Excel Template is geared towards companies forecasting sales of products and services.
If you find this template helpful, you’ll also love other finance and management templates like our Cash Flow Planning, Business Valuation, Balanced Scorecard, Profitability Analysis and Variance Analysis templates. Each of these templates help you calculate and understand your business betters through automated formulas and visually compelling dashboards.
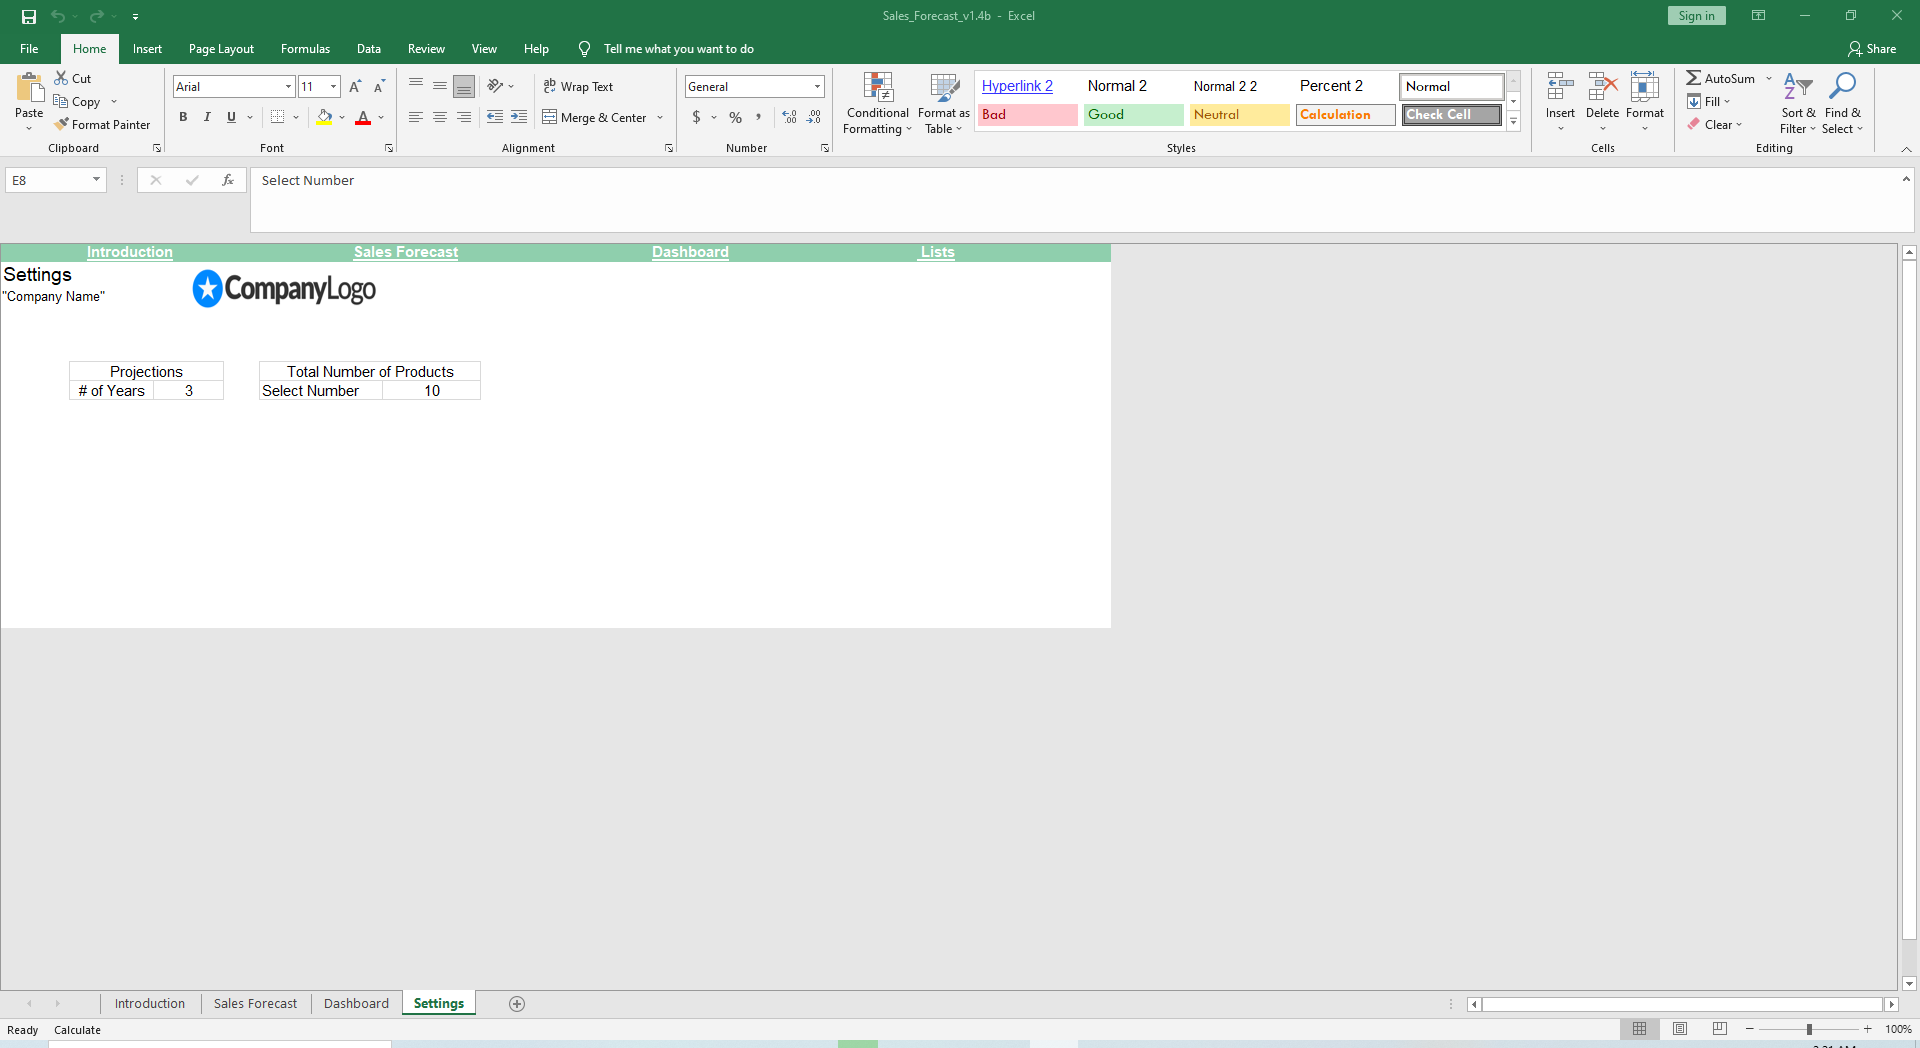
To start, click on the Settings tab and choose whether you want 2 or 3 years of projections and the total number of products you’d like to forecast. You can choose up to 25 products.
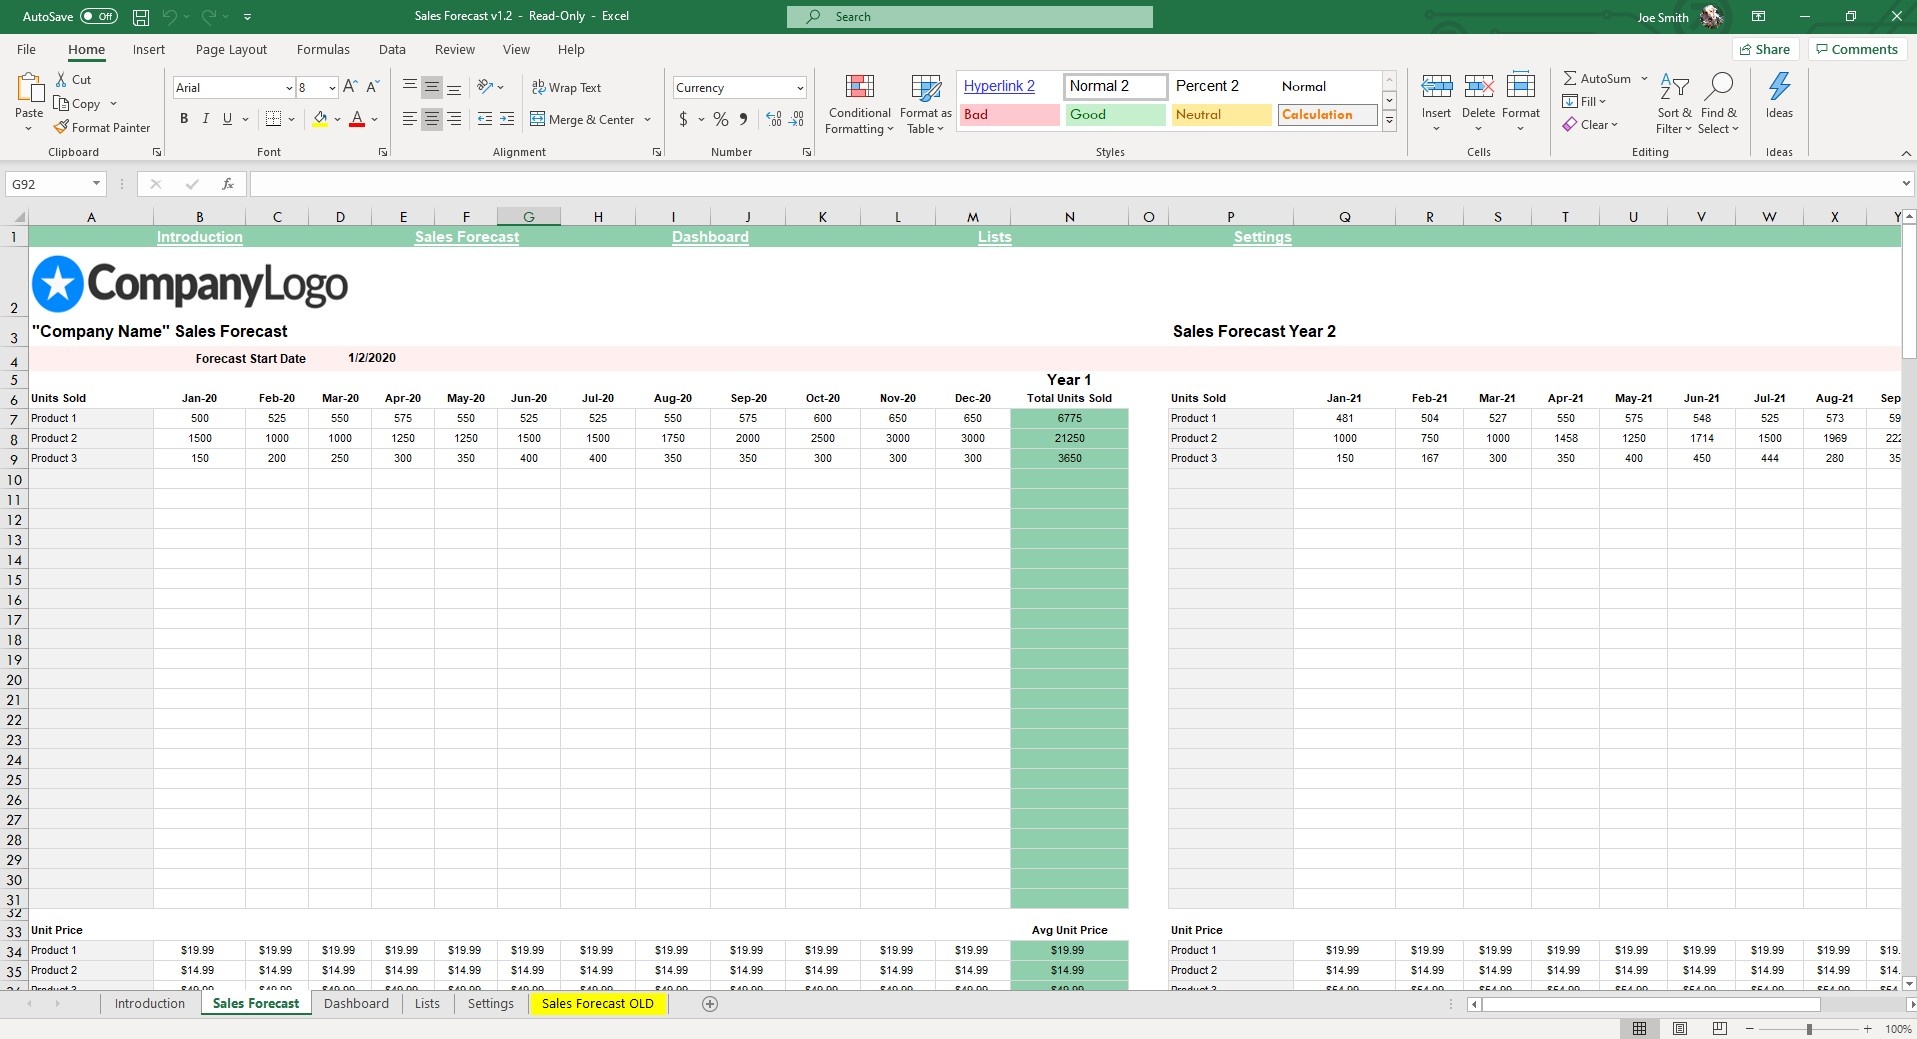
Navigate over to the Sales Forecast sheet. List the name of your products starting in cell M7. All mentions of that product will automatically update in the rest of the sheet. In cell P4, set the date for which you want the Forecast Start Date.
Staying in the Sales Forecast sheet, input the Units Sold for each product. Below that table, input the Unit Price for each product. Enter the first year’s sales growth rate for each product in the ‘Sales Growth Rate’ table. Lastly, enter the Unit COGS for each product.
For the second and third year projections, you’ll need to enter the Unit Price, Project Sales Growth Percentage, and Unit COGS for each item.


In the far right column, a Year-to-Year comparison will automatically generate. It will calculate the percentage change over Year 1 to Year 2 or Year 3 for Units Sold, Unit Price, Sales Growth Rate, Revenue, Total Gross Profit, Unit COGS and Total Gross Profit.
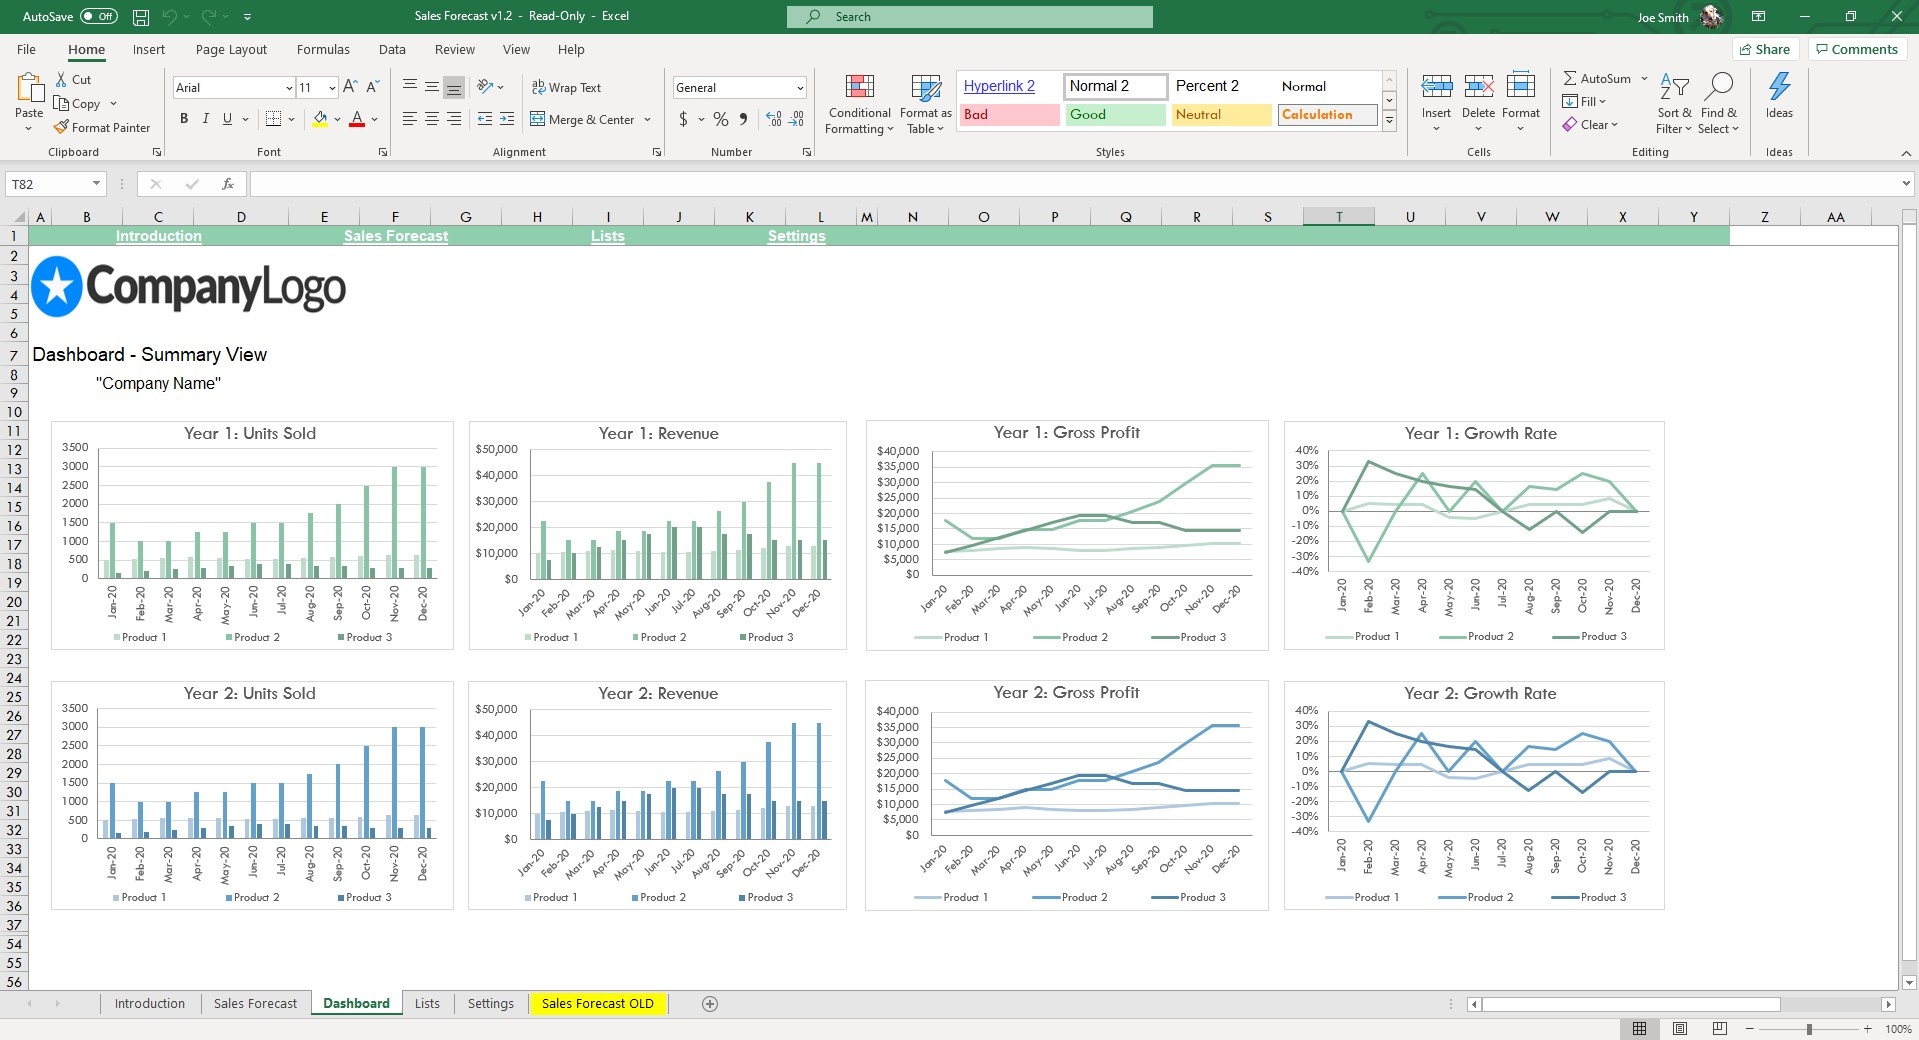
Move over to the Dashboard sheet and your numbers will come to life in the form of graphs.
If the numbers didn’t make it obvious, the graphs will. They will showcase trends, dips and surges among forecasted numbers.
By understanding these KPIs, you’re able to put your business in the best position to succeed.


